Category Archives: blood testing

Ending Aging-Related Diseases 2019: Lustgarten Presentation

In the first half of this presentation, I talk about my contribution to the gut-muscle axis in older adults, and in the second half, my personalized approach to optimal health!

Also, here’s the article that corresponds to the presentation:
https://www.leafscience.org/the-gut-microbiome-affects-muscle-strength-in-older-adults/

If you’re interested, please have a look at my book!

Optimizing Biological Age: RDW%

Can biological age be optimized? The red blood cell (RBC) distribution width (RDW%) is one of the variables included in the PhenoAge biological age calculator (see https://michaellustgarten.wordpress.com/2019/09/09/quantifying-biological-age/). Although the RDW% reference range is 11.5% – 14.5%, what values are optimal in terms a youthful biological age, and minimized disease risk?

First, let’s define RDW%. RDW% is calculated by dividing the standard deviation of the average mean corpuscular volume (i.e. the average volume inside red blood cells, defined as MCV, upper right panel; image via Danese et al. 2015). When the volume inside red blood cells is approximately the same across all RBCs (upper left panel), the RDW% will be narrow, as shown by the dashed line in the upper right panel.  Conversely, during aging and in many diseases, the size and volume of RBCs are altered, resulting in a more broad RDW% (bottom left and right panels):

ani

In terms of RDW%, what’s optimal for health and longevity? In the the largest study  (3,156,863 subjects) that investigated the association for risk of death for all causes with RDW%, maximally reduced risk of death was observed for RDW% between 11.4 – 12.5% (percentiles 1-5, 5-25), with mortality risk increasing for values < 11.3%, and > 12.6% (Tonelli et al. 2019):

rdw 2

This has been confirmed in other relatively large studies (240,477 subjects), as RDW% values < 12.5% were associated with maximally reduced all-cause mortality risk, with values > 12.5 associated with an increasing all-cause mortality risk (Pilling et al. 2018):

rdw 3

How does RDW% change during aging? For the 1,907 subjects of Lippi et al. (2014), RDW% increased during aging:

rdw 4

In support of this finding, RDW% also increased during aging in a larger study that included 8,089 subjects (Hoffmann et al. 2015).

Collectively, when considering the all-cause mortality and aging data, RDW% values ~ 12.5% may be optimal for health and longevity. What are my RDW% values? Plotted below are 18 RDW% measurements since 2015 (blue circles). First, note my average RDW% during that time (black line) is 12.8%, which isn’t far from the 12.5% that may be optimal for health and longevity. However, note the trend line (red), which indicates that my RDW% values are increasing during aging!

rdw 5

How do I plan on reducing my RDW%? A moderate strength correlation exists between my calorie intake with RDW% (r = 0.53), with a higher daily average calorie intake being associated with a higher RDW%:
my rdw
My plan is to shoot for a daily calorie intake ~2600 over the next month, and then retest my RDW% (and the rest of the CBC). Hopefully that brings my RDW% down to 12.5% or less. If that doesn’t work, I’ll re-calibrate, and try something else!

If you’re interested, please have a look at my book!

References

Danese E, Lippi G, Montagnana M. Red blood cell distribution width and cardiovascular diseasesJ Thorac Dis. 2015 Oct;7(10):E402-11. doi: 10.3978/j.issn.2072-1439.2015.10.04.

Hoffmann JJ, Nabbe KC, van den Broek NM. Red cell distribution width and mortality in older adults: a meta-analysis. Clin Chem Lab Med. 2015 Nov;53(12):2015-9. doi: 10.1515/cclm-2015-0155.

Lippi G, Salvagno GL, Guidi GC. Red blood cell distribution width is significantly associated with aging and gender. Clin Chem Lab Med. 2014 Sep;52(9):e197-9. doi: 10.1515/cclm-2014-0353.

Pilling LC, Atkins JL, Kuchel GA, Ferrucci L, Melzer D. Red cell distribution width and common disease onsets in 240,477 healthy volunteers followed for up to 9 years. PLoS One. 2018 Sep 13;13(9):e0203504. doi: 10.1371/journal.pone.0203504.

Tonelli M, Wiebe N, James MT, Naugler C, Manns BJ, Klarenbach SW, Hemmelgarn BR. Red cell distribution width associations with clinical outcomes: A population-based cohort studyPLoS One. 2019 Mar 13;14(3):e0212374. doi: 10.1371/journal.pone.0212374.

Quantifying Biological Age

In an earlier post, I wrote about quantifying my biological age with aging.ai (https://michaellustgarten.wordpress.com/2018/06/26/maximizing-health-and-lifespan-is-calorie-restriction-essential/). The importance of that post is illustrated by the finding that based on data from 13 blood tests between 2016 – 2019, my average biological age is 29.2y, which is ~33% younger than my chronological age.

On my quest for optimal health, I’m striving to get as accurate as possible when it comes to quantifying biological age. While the aging.ai biomarker set is strongly correlated with biologic age (r = 0.80), in 2018 two papers were published (Liu et al., Levine et al.) that introduced “Phenotypic Age”, which includes a combination of 9 circulating biomarkers + chronological age that is better at predicting biological age (r = 0.94) than aging.ai. It includes analytes that are found on the standard blood chemistry screen, including albumin, creatinine, glucose, lymphocyte %, mean corpuscular volume (MCV), red blood cell distribution width (RDW), alkaline phosphatase, white blood cells, and an analyte that is not found on that panel, C-reactive protein (CRP). In addition, chronological age is included as a covariate.

So what’s my biological age based on the Phenotypic Age calculator? When I input my data from my latest blood test measurement on 6/4/2019, I get a biological age of 35.39y, which is 23% lower than my chronological age of 46. Not bad!

phenoage

To quantify your biological age with the Phenotypic Age calculator, input your data in the Excel file that is embedded within the first paragraph of the following link:

DNAmPhenoAge_gen

3.27.25 Edit: In the link above, note that the denominator in D17 should be 0.090165, not 0.09165. Additionally, the units for albumin should be g/dL (not mg/dL), and lymphocyte isn’t spelled correctly. I can’t upload a new link-I’d have to upgrade my WordPress account to be able to upload files (which is ridiculous!).

If you’re interested, please have a look at my book!

References

Liu Z, Kuo PL, Horvath S, Crimmins E, Ferrucci L, Levine M. A new aging measure captures morbidity and mortality riskacross diverse subpopulations from NHANES IV: A cohort studyPLoS Med. 2018 Dec 31;15(12):e1002718. doi: 10.1371/journal.pmed.1002718.

Levine ME, Lu AT, Quach A, Chen BH, Assimes TL, Bandinelli S, Hou L, Baccarelli AA, Stewart JD, Li Y, Whitsel EA, Wilson JG, Reiner AP, Aviv A, Lohman K, Liu Y, Ferrucci L, Horvath S. An epigenetic biomarker of aging for lifespan and healthspanAging (Albany NY). 2018 Apr 18;10(4):573-591. doi: 10.18632/aging.101414.

LP(a), cardiovascular disease, and all-cause mortality: What’s optimal?

Very low, low, and high-density lipoproteins (VLDL, LDL, HDL, respectively) are commonly measured on the standard blood chemistry panel as measures of cardiovascular disease risk. Not included on that panel is another lipoprotein, Lp(a), which is a modified form of LDL. What’s the relationship between Lp(a) with disease risk?

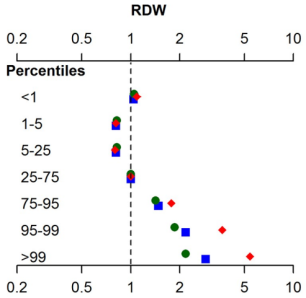
A meta-analysis of 36 studies that included 126,634 subjects reported that Lp(a) > 30 mg/dL (65 nmol/L) was significantly associated with an increased risk for heart attacks, coronary heart disease-related deaths, and ischemic strokes (Erqou et al.  2009):

Screen Shot 2019-08-31 at 8.32.04 PM

Investigating further, of 2,100 candidate genes that were evaluated for predicting heart disease risk, genetic variation in the LPA gene was the strongest genetic risk factor (Clarke et al. 2009). Of the Lp(a)-related genes, SNPs for rs3798220 (increased risk allele = C) and rs10455872 (increased risk allele = G) were associated with a 92% and a 70% increased risk for coronary heart disease, respectively.

Based on these data, Lp(a) values less than 50 mg/dL (108 nmol/L) have been recommended, with 1-3 grams/day of niacin, which reduces Lp(a) levels, as the primary treatment for minimizing cardiovascular disease risk (Nordestgaard et al. 2010).

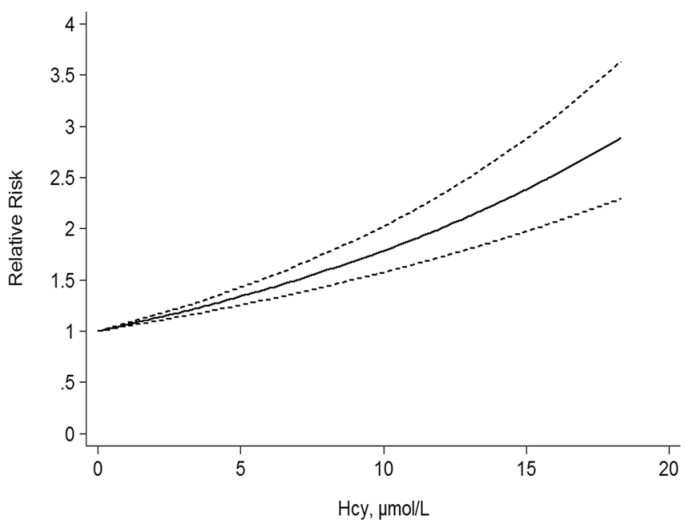
However, cardiovascular disease is only 1 outcome. What’s the data for Lp(a) and risk of death from all causes, not just cardiovascular disease-related deaths? In a study of 10,413 adults (average age, 55y), the lowest risk of death from all causes was reported for Lp(a) values of 270 mg/L (equivalent to 27 mg/dL, and 58 nmol/L). The log of 270 is 2.43, which corresponds to the lowest mortality risk on the chart below (Sawabe et al. 2012):

Screen Shot 2019-09-01 at 11.54.55 AM

Interestingly, all-cause mortality risk was significantly increased only for Lp(a) values < 80 mg/L (log 80 = 1.90; equivalent to 17 nmol/L), when compared with intermediate (80 – 550 mg/L; log values from 1.9 – 2.7 on the chart; equivalent to 17 – 118 nmol/L) and high Lp(a) (> 550 mg/L; log values > 2.7 on the chart; equivalent to > 118 nmol/L).

In addition to low Lp(a) values, an increased risk of death from all causes (and a shorter lifespan) have also been reported for high Lp(a). When compared with Lp(a) < 21 nmol/L, Lp(a) > 199 nmol/L was associated with a 20% increased all-cause mortality risk (Langsted et al. 2019). In addition, median lifespan was 1.4 years shorter for subjects that had  Lp(a) values > 199 nmol/L, when compared with < 21 nmol/L.

Based on the studies of Sawabe and Langsted, both low and high Lp(a) values may be bad for disease risk. What are my Lp(a) values?

I’ve been tracking Lp(a) for the past 14 years, first, approximately 1x/year until I was 40, and second, 9 times since 2015, when I started daily nutrition tracking. In addition, I’ve measured it 4x in 2019, with the goal of getting it closer to the 58 nmol/L value of the Sawabe study. When I first started measuring Lp(a) in 2005, it was ~150 nmol/L, which is way higher than the < 65 nmol/L that was reported for reduced cardiovascular disease risk in the Erqou meta-analysis, and the 58 nmol/L value that was reported for maximally reduced all-cause mortality risk in the Sawabe study:

Picture1

Fortunately, I was able to reduce my Lp(a) levels from those first values to levels closer to ~100 nmol/L, which is still too high. For the first 8 Lp(a) measurements, I didn’t track my nutrition, so I can’t say which factors helped me to reduce it. Also, note that I didn’t include the blood test measurement where I tried high dose niacin (3 g/day), which reduced my Lp(a) to 84 nmol/L, but also worsened my liver function,. My liver enzymes, AST and ALT doubled on high-dose niacin! What good is a reduced risk for cardiovascular disease if my risk for liver disease simultaneously goes up? Obviously, I quickly discontinued use of niacin to reduce Lp(a).

Also note the data on the chart since 2015, when I started daily nutritional tracking. Over that period, my average value over 9 Lp(a) measurements is 95.3 nmol/L. Although my average Lp(a) is still higher than it should be, it’s better than my pre-tracking Lp(a) average value of 115.6 nmol/L (p-value = 0.03 for the between-group comparison). In addition, on my last 3 measurements, my Lp(a) values were 75, 82, and 79 nmol/L. How have I been reducing it?

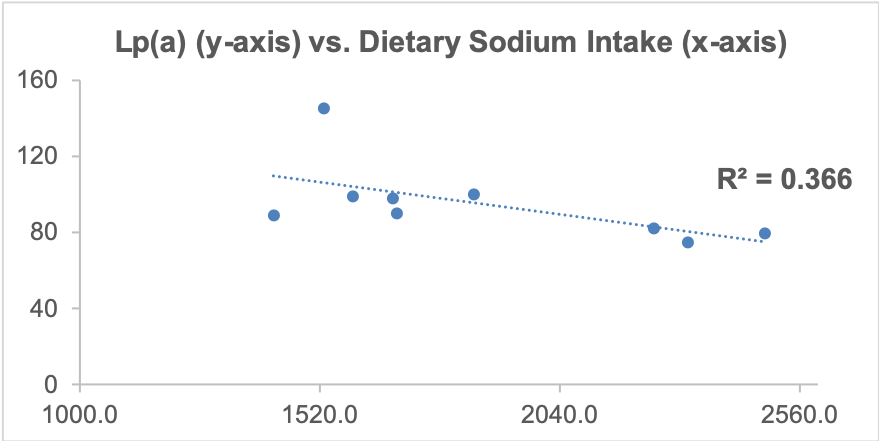
As I’ve mentioned in many blog posts, I’ve been weighing, logging, and tracking my nutrient intake since 2015. When I blood test, I can use the average dietary intake that corresponds to the blood test result, and with enough blood test results, I can look at correlations between my diet with blood test variables. Based on this approach, one possibility is my daily sodium intake. Shown below is a moderately strong correlation (r = 0.61, R^2 = 0.366) between my daily sodium intake with Lp(a). The higher my sodium intake, the lower my Lp(a) values.

lpa vs na.png

Can the strength of this approach be improved? Interestingly, I identified another moderately strong correlation (r = 0.69) between my lycopene intake with Lp(a): the higher my lycopene intake, the higher my Lp(a)! I then decided to include both sodium and lycopene in a linear regression model, and the correlation for both of these nutrients with Lp(a) is 0.90! So what will I do with this info?

The highest that my average dietary sodium intake has been in any blood testing period is ~2500 mg. Sodium levels higher than that seem to negatively affect my sleep, so I’m not interested in going higher than 2500 mg/day. Also, there may be a plateau effect for sodium, as values ~2500 mg/day didn’t associate with significantly lower Lp(a) values when compared with 2300 mg/day. I can, in contrast, reduce my lycopene intake, which comes almost exclusively from my daily watermelon intake. I usually eat ~7 oz/day, and for my next blood test I’ll reduce this to 5 oz/day. Based on the regression equation that includes sodium and lycopene, with a 2300 mg sodium intake and the amount of lycopene that corresponds to 5 oz. of daily watermelon (~6700 micrograms, down from ~9000 micrograms), I should expect to see a Lp(a) value ~67 nmol/L on my next blood test. If not, I’ll repeat this approach, looking for strong correlations between my diet with Lp(a), followed by tweaking my diet to obtain biomarker results that are close to optimal. Stay tuned my my next blood test data, coming in about 2 weeks!

If you’re interested, please have a look at my book!


References

Clarke, R., J. F. Peden, J. C. Hopewell, T. Kyriakou, A. Goel, S. C. Heath, S. Parish, S. Barlera, M. G. Franzosi, S. Rust, et al. 2009. Genetic variants associated with Lp(a) lipoprotein level and coronary disease. N. Engl. J. Med. 361: 2518–2528.

Erqou, S., S. Kaptoge, P. L. Perry, A. E. Di, A. Thompson, I. R. White, S. M. Marcovina, R. Collins, S. G. Thompson, and J. Danesh. 2009. Lipoprotein(a) concentration and the risk of coronary heart disease, stroke, and nonvascular mortality. JAMA. 302: 412–423.

Langsted A, Kamstrup PR, Nordestgaard BG. High lipoprotein(a) and high risk of mortalityEur Heart J. 2019 Jan 4. [Epub ahead of print].

Sawabe M, Tanaka N, Mieno MN, Ishikawa S, Kayaba K, Nakahara K, Matsushita S; JMS Cohort Study Group. Low Lipoprotein(a) Concentration Is Associated with Cancer and All-Cause Deaths: A Population-Based Cohort Study (The JMS Cohort Study). PLoS One. 2012; 7(4): e31954. PLoS One. 2012;7(4):e31954.

Nordestgaard BG, Chapman MJ, Ray K, Borén J, Andreotti F, Watts GF, Ginsberg H, Amarenco P, Catapano A, Descamps OS, Fisher E, Kovanen PT, Kuivenhoven JA, Lesnik P, Masana L, Reiner Z, Taskinen MR, Tokgözoglu L, Tybjærg-Hansen A; European Atherosclerosis Society Consensus Panel. Lipoprotein(a) as a cardiovascular risk factor: current status. Eur Heart J. 2010 Dec;31(23):2844-53.

Dietary Cholesterol Vs. Plasma Cholesterol: My n=1 Data

With use of a food scale,  I’ve been tracking my daily macro- and micronutrient intake every day since April 2015. In addition, I have 15 blood test measurements during that period, and accordingly, I’m able to examine correlations between my dietary intake with my circulating biomarkers. In this post, I’ll address the question, is my dietary cholesterol intake significantly correlated with plasma levels of cholesterol?

1. Plasma levels of total cholesterol vs. dietary cholesterol:

tc.png

In the plot we see a borderline significant (p = 0.06), moderate correlation (r = 0.5) between my plasma total cholesterol with my dietary cholesterol intake. However, note that total cholesterol is comprised of “good” and “bad” parts, with HDL as the “good”, and with non-HDL cholesterol, including LDL and VLDL, as the “bad”. What does that data look like?

2. Plasma levels of non-HDL (LDL+VLDL) cholesterol vs. dietary cholesterol:

nonhdl.png

In the plot we see a highly significant (p = 0.006), strong correlation (= 0.67) between my non-HDL cholesterol levels with my dietary cholesterol intake. It’s not possible to show causation via correlation, but this data suggests that my dietary cholesterol intake may be driving increased levels of non-HDL cholesterol.

3. Plasma levels of HDL cholesterol vs. dietary cholesterol:

hdl.png

In the plot, first note that in contrast with the positive correlations between total and non-HDL cholesterol with my dietary cholesterol intake, the correlation between HDL with my dietary cholesterol intake is negative (i.e., going in the opposite direction; r = 0.51), and borderline significant (p = 0.054).

Cumulatively, it looks like my dietary cholesterol intake may be related to increased “bad” cholesterol and decreased “good” cholesterol. As a limitation of this approach, although I’ve shown blood test data for 15 measurements (which is a decent sample size), I only have 4 measurements with an average daily cholesterol intake around 200 mg or greater. In the near future, I expect to average 200 mg of daily cholesterol (or more) per day, so let’s see if these correlations hold up!


If you’re interested, please have a look at my book!


Serum Albumin Decreases During Aging: Can Diet Help?

Levels of serum albumin peak at about 20 years old (~4.6 g/dL for males, ~4.4 g/dL for females), then decrease during aging, as shown for the 1,079,193 adults of Weaving et al. (2016):

Screen Shot 2018-07-04 at 1.19.29 PM.png

Similar age-related decreases for serum albumin albumin have also been reported in smaller studies: Gom et al. 2007 (62,854 subjects); Dong et al. 2010 (2,364 subjects); Le Couteur et al. 2010 (1,673 subjects); Dong et al. 2012 (1,489 subjects).

Why is it important that serum levels of albumin decrease during aging? Reduced levels of albumin are associated with an increased risk of death from all causes. For example, in the 1,704,566 adults of Fulks et al. 2010, serum albumin levels > 4.4 g/dL and 4.5 g/dL for females and males, respectively, were associated with maximally reduced risk of death from all causes, regardless of age (younger than 50y, 50-69y, or 70y+):

albumin mort.png

The association between reduced levels of serum albumin with an increased risk of death from all causes have also been found in smaller studies. In a ~9 year study of 7,735 men (age range, 40-59y), when serum albumin was less than 4 g/dL, the mortality rate was 23/1000/per year, compared with 4/1000/per year for subjects with values greater than 4.8 g/dL (Phillips et al. 1989):

albumin 3 mort

Similarly, in older adults (average age, ~80y, 672 subjects), serum albumin levels  greater than 4.5 g/dL (equivalent to 45 g/L) were associated with significantly reduced all-cause mortality risk, when compared with compared with < 4.1 g/dL (equivalent to 41 g/L, Takata et al. 2010):

albumin 2 mort

Decreased levels of serum albumin (less than 4 g/dL) being associated with an increased all-cause mortality risk was also identified in a 12-year study of 287 older adults (average age, ~75y, Sahyoun et al. 1996).

Can the age-related decrease in serum albumin be minimized, or prevented? Shown below is my data for serum albumin since 2005, when I was 32y:

alb

First, note the period from when I was 32y until 40y. No age-related decrease! My average albumin value over 7 measurements was 4.74 g/dL. Unfortunately, I didn’t track my dietary info during that time.

Also note the period from 43y to 45y. First, my albumin levels are significantly higher than the first period, 4.92 g/dL (p=0.027)! Second, again note the absence of an age-related decrease. Based on the data of Weaving et al. (2016), my albumin levels should be around 4.4 g/dL, but I’ve got them going in the opposite direction! How have I been able to do that?

Since April 2015, with use of a food scale, I’ve been tracking my daily dietary intake, including macro and micronutrients (54 variables). For each orange data point in the second period, I have an average dietary intake for each of the 54 variables that I can use to correlate with serum albumin. Based on that data, I can make an educated guess at what could potentially increase, or decrease it.

Of the 54 dietary variables that I track, only 3 were significantly correlated with albumin: positive associations for alpha-carotene (r = 0.66, p = 0.027), beta-carotene (r = 0.75, p =0.007), and a negative association for Vitamin K (r = -0.64, p = 0.03). Shown below is the strongest correlation of the three, beta-carotene, vs. serum albumin.

bcarot alb.png

The majority of my alpha and beta-carotene intake comes from carrots, with a smaller amount coming from butternut squash. Interestingly, beta-cryptoxanthin, a Vitamin A metabolite that is abundant in butternut squash, was not significantly associated with serum albumin. Butternut squash is also a good source of alpha- and beta-carotene, so if  butternut squash was driving the correlation between the carotenes with albumin, I’d expect beta-crypoxanthin to also be significantly associated with it. However, since it’s not, carrots are the most likely source driving the association. Also note that the my average intake of Vitamin K is dramatically higher (1410 mcg; range, 1080-2203 mcg) than the RDA or AI, which are ~100-120 mcg/day. The negative association between my Vitamin K intake with albumin suggests that I should keep it closer to 1100 mcg/day to potentially keep my albumin levels high.

If you’re interested, please have a look at my book!


References

Dong MH, Bettencourt R, Barrett-Connor E, Loomba R. Alanine aminotransferase decreases with age: the Rancho Bernardo Study. PLoS One. 2010 Dec 8;5(12):e14254.

Dong MH, Bettencourt R, Brenner DA, Barrett-Connor E, Loomba R. Serum levels of alanine aminotransferase decrease with age in longitudinal analysis. Clin Gastroenterol Hepatol. 2012 Mar;10(3):285-90.e1.

Gom I, Fukushima H, Shiraki M, Miwa Y, Ando T, Takai K, Moriwaki H. Relationship between serum albumin level and aging in community-dwelling self-supported elderly population. J Nutr Sci Vitaminol (Tokyo). 2007 Feb;53(1):37-42.

Dong MH, Bettencourt R, Barrett-Connor E, Loomba R. Alanine aminotransferase decreases with age: the Rancho Bernardo Study. PLoS One. 2010 Dec 8;5(12):e14254.

Fulks M, Stout RL, Dolan VF. Albumin and all-cause mortality risk in insurance applicants. J Insur Med. 2010;42(1):11-7.

Le Couteur DG, Blyth FM, Creasey HM, Handelsman DJ, Naganathan V, Sambrook PN, Seibel MJ, Waite LM, Cumming RG. The association of alanine transaminase with aging, frailty, and mortality. J Gerontol A Biol Sci Med Sci. 2010 Jul;65(7):712-7.

Phillips A, Shaper AG, Whincup PH. Association between serum albumin and mortality from cardiovascular disease, cancer, and other causes. Lancet. 1989 Dec 16;2(8677):1434-6.

Sahyoun NR, Jacques PF, Dallal G, Russell RM. Use of albumin as a predictor of mortality in community dwelling and institutionalized elderly populationsJ Clin Epidemiol. 1996 Sep;49(9):981-8.

Takata Y, Ansai T, Soh I, Awano S, Sonoki K, Akifusa S, Kagiyama S, Hamasaki T, Torisu T, Yoshida A, Nakamichi I, Takehara T. Serum albumin levels as an independent predictor of 4-year mortality in a community-dwelling 80-year-old population. Aging Clin Exp Res. 2010 Feb;22(1):31-5.

Weaving G, Batstone GF, Jones RG. Age and sex variation in serum albumin concentration: an observational study. Ann Clin Biochem. 2016 Jan;53(Pt 1):106-11.

Optimizing Biological Age: Is Calorie Restriction Essential?

My goal is to break the world record for lifespan, 122 years, which is currently held by Jean Calment. How do I plan to do that? A good start would be calorie restriction (CR), a diet where you eat 10-30%+ less calories than your normal intake. CR is the gold standard for increasing lifespan in a variety of organisms, including yeast, flies, worms, and rodents (McDonald et al. 2010).

With the goal of maximizing my health and lifespan, in April 2015, I started a CR diet. Inherent in that was weighing all my food and recording it on an online website that tracks macro-and micro-nutrients. From then until March 2016, I was pretty good at keeping my calories relatively low, as I averaged 2302 calories. However, since 3/2016, it’s been exceedingly difficult to keep my calories that low, as I’ve averaged 2557 calories/day. So is having a higher calorie intake worse for my lifespan goal than a lower calorie intake?

Maybe not. In addition to tracking my daily nutrition since 2015, I’ve also had regular blood testing performed. I’ve measured the typical things that you get at a yearly checkup, including the lipid profile (triglycerides, total cholesterol, LDL, HDL, VLDL) markers of kidney and liver  function (BUN, creatinine, uric acid, and ALT, AST, respectively), and the complete blood count (red and white blood cells, and their differentials). By tracking my daily nutrition and circulating biomarkers, I’m able to quickly intervene on any potential aging and disease-related mechanisms by using my diet to optimize my circulating biomarkers.

On my quest for optimal health and lifespan, biological age is more important than my chronological age (I’m 46y). So what’s my biological age? Between 2016-2019, the group at Insilico Medicine published 2 papers that included circulating biomarker data from more than 200,000 people (Putin et al. 2015, Mamoshina et al. 2018) to derive a biological age predictor (aging.ai). So what’s my biological age?

Shown below is my predicted biological age over 13 blood tests from 3/2016 to 6/2019:

agingai2

Although I wasn’t on a CR diet during that time, my average biological age was 29.2 years, which is ~34% younger than my chronological age. Would my biological age be even younger with a lower calorie intake? I’m working on reducing my calorie intake again (it’s not easy for me), so stay tuned for that!

Here are the my biomarker values corresponding to each blood test, for anyone who wants to double check the results:
agingai2 values

References

Mamoshina P, Kochetov K, Putin E, Cortese F, Aliper A, Lee WS, Ahn SM, Uhn L, Skjodt N, Kovalchuk O, Scheibye-Knudsen M, Zhavoronkov A. Population specific biomarkers of human aging: a big data study using South Korean, Canadian and Eastern European patient populations. J Gerontol A Biol Sci Med Sci. 2018 Jan 11.

McDonald RB, Ramsey JJ. Honoring Clive McCay and 75 years of calorie restriction research. J Nutr. 2010 Jul;140(7):1205-10.

Putin E, Mamoshina P, Aliper A, Korzinkin M, Moskalev A, Kolosov A, Ostrovskiy A, Cantor C, Vijg J, Zhavoronkov A. Deep biomarkers of human aging: Application of deep neural networks to biomarker development. Aging (Albany NY). 2016 May;8(5):1021-33.

If you’re interested, please have a look at my book:

Reducing Homocysteine? Updates.

In an earlier post I wrote about the association between elevated circulating levels of homocysteine with an increased risk of death from all causes (https://michaellustgarten.wordpress.com/2017/11/22/homocysteine-and-all-cause-mortality-risk/). I started to post updates in that link, but I’ve decided to move them to here.

As of 6/2018, I now have tracked dietary data (I weigh all my food and record the values in cronometer.com) that corresponds to 7 homocysteine measurements:
Picture1

12/5/2017: Despite 42 days of 800 micrograms of supplemental folic acid, bringing my average daily folate intake to 2026 micrograms/day, my plasma homocysteine was essentially unchanged at 11.7 uMoL, when compared with my baseline value of 11.8 uMol.What’s next on the list to reduce it? Trimethylglycine, also known as betaine. I’m a proponent of using diet as a first strategy,  and to increase my dietary betaine levels, I’ll eat beets and quinoa, bringing my daily betaine levels to ~500 mg/day. Let’s see how it turns out on my next blood test!

1/2/2018: ~500 mg/day of betaine from beets and quinoa did absolutely nothing to my homecysteine levels. In fact, it got worse (15.3 uMoL)! To test the hypothesis that it wasn’t enough betaine, next I tried 4 grams/day of betaine (also known as trimethylglycine, TMG).

2/20/18: Supplemental TMG did absolutely nothing in terms of reducing my homocysteine to values below baseline! Also note that there is evidence that TMG increases blood lipids, including LDL and triglycerides (TG; Olthof et al. 2005), and that’s exactly what it did to me. My average LDL and TG values since 2015 (11 measurements) are 77 and 50 mg/dL, respectively. On TMG, these values increased to 92 and 72 mg/dL, respectively, making them my highest values over 11 individual blood tests (with the exception of 1 day with an LDL of 93 mg/dL). Next, I tried a stack that included 50 mg of B6, 1000 mcg of B12, and 400 mcg of methylfolate, as supplementation with these B-vitamins has been shown to lower homocystine (Lewerin et al. 2003).

3/20/18: Finally, some progress! My homocysteine levels were reduced during the B-vitamin supplementation period. I’ve written it like that because I’m not sure if it was the B-vitamins that caused it. For example, in the image below, we see the correlation between my dietary B6 intake with homocysteine. The trendline is down, which I would expect if B6 supplementation actually is playing a role in reducing my homocysteine levels. However, note that the correlation between my dietary B6 levels with homocysteine is not very strong (= .48), resulting in a moderate R2 of 0.23 (similar data was obtained for B12 and folate). With 5 blood test measurements corresponding to 5 dietary periods, if B6 is playing a role, I would expect a stronger correlation. Nonetheless, with more data, the correlation may strengthen, so stay tuned for that!

b6hcy.png

5/14/2018: I changed B6-B12-methylfolate supplements so that I’d only have to take pills from 1 bottle instead of from 3. That supplement, however, had 1.5 mg of B6 instead of the 50 mg that was in my original supplement. Less B6 didn’t result in a higher homocysteine value-in fact, it went down (slightly), from 10.8 to 10.6. If an increased amount of B6 was causing lower levels of homocysteine, I would’ve expected higher, not (barely) lower homocysteine levels. This suggests that maybe my B6 intake has nothing to do with my homocysteine levels.

6/4/2018: Despite no changes to my supplements, my homocysteine came down a little more, to 10.2. Interestingly, the correlation (r) between homocysteine with my total dietary (diet + supplements) intake of B6, B12, and methylfolate is 0.39, 0.68, 0.29, respectively. The correlation between my B12 intake with homocysteine looks moderately strong, whereas the correlations for B6 and folate are weak. Based on this data, it’s possible I had a mild B12 deficiency that was causing elevated homocysteine. Note that my average B12 intake, without supplements is ~8 mcg/day, which is more than 3-fold higher than the RDA.

In looking at the association between my dietary data with homocysteine, a stronger correlation (r = 0.91; R2 = 0.83) has emerged…for my protein intake! In other words, a higher protein intake is more strongly correlated with lower homocysteine than B12:

Picture2

7/11/2018: To explore the strong association between my protein intake with homocysteine, I increased my protein intake from an average value of 104 g/day for the period that preceded my June measurement (5/15/2018 – 6/4/2018) to 136 g/day for the period up to my 7/11/2018 measurement (6/5/2018 – 7/10/2018). The result? Lower homocysteine, to 8.2 uMol/L! Interestingly, the correlation between my dietary protein intake with homocysteine remained strong (r = 0.86, R2 = 0.73, n = 7 measurements).

What about my B6, methyl-B12, methyl-folate stack? I’m still taking it, although it looks like methyl-B12 may be the only factor that is associated with my homocysteine levels. In support of that, the correlation between each with homocysteine is = 0.02, 0.73, 0.36, respectively.

Because I now have my homocysteine < 9 umol/L, it may be time to optimize other variables (in addition to the metabolic panel and CBC). Stay tuned!

If you’re interested, please have a look at my book:


References

Lewerin C, Nilsson-Ehle H, Matousek M, Lindstedt G, Steen B. Reduction of plasma homocysteine and serum methylmalonate concentrations in apparently healthy elderly subjects after treatment with folic acid, vitamin B12 and vitamin B6: a randomised trial.vEur J Clin Nutr. 2003 Nov;57(11):1426-36.

Olthof MR, van Vliet T, Verhoef P, Zock PL, Katan MB. Effect of homocysteine-lowering nutrients on blood lipids: results from four randomised, placebo-controlled studies in healthy humans. PLoS Med. 2005 May;2(5):e135.

Homocysteine and All-Cause Mortality Risk

On a recent blood test, my plasma level of homocysteine (Hcy) was 11.9 uMol. Is that optimal minimizing disease risk and maximizing longevity? Let’s have a look at the literature.

A 2017 meta-analysis of 11 studies including 27,737 participants showed an increased risk of death from all causes (“all-cause mortality”; ACM) as circulating levels of homocysteine increase (Fan et al. 2017):

hcy acm.png

When looking at meta-analyses, it’s important to examine each of the individual studies. Here are the data for the 11 included studies:

  • Kark et al. 1999: 1,788 older adults, average age 65y, followed for 9-11 years. Compared with values less than 8.5 uMol, subjects with elevated homocysteine (> 14.7) had a 2-fold higher risk of death from all causes.
  • Bostom et al. 1999: 1,933older adults, verage age, 70y, median follow-up, 10y. Subjects with values > 14.3 uMol had 2-fold ACM risk, when compared with < 14.3.
  • Hoogeveen et al. 2000: 811 older adults (average age, 65y), 5 yr follow-up. Non- diabetics had a 34% increased ACM risk (p=0.08), but diabetics had 2.5-fold increased ACM risk after a 5-yr follow-up.
  • Vollset et al. 2001: 4,766 older adults (age range, 65-67y at study entry), median 4 yr follow-up. Compared with 5.1-8.9 uMol, values greater than 12 were significantly associated with a 2.4-4.5 increased ACM risk.
  • Acevedo et al. 2003. 3,427 subjects, average age 56y, ~3yr follow-up. ACM risk lowest for < 9.4 uMol, compared with > 14.4.
  • González et al. 2007: 215 older adults (average age, 75y), median 4 yr follow-up. Compared with < 8.7 uMol, values > 16.7 had 2.3-fold increased ACM risk.
  • Dangour et al. 2008: 853 older adults (average age, 79y), ~7.6y follow-up. Homocysteins > 19.4 uMol associated with ~2-fold higher ACM risk, when compared with < 9.8.
  • Xiu et al. 2012: 1,412 older adults (average age, ~75y), up to 10 year follow-up. 1.8-fold higher ACM risk comparing those with >14.5 uMol with < 9.3.
  • Waśkiewicz et al. 2012: 7,165 middle aged adults, ~5yr follow- up. 1.8-fold increased ACM risk for subjects with homocysteine > 10.5 uMol(average age, 52y) when compared with < 8.2 (avg age, 40y).
  • Wong et al. 2013: 4,248 older men, average age ~77y, ~5yr follow-up. 1.5-fold increased ACM risk for homocysteine values > 15 uMol.
  • Swart et al. 2012: 1,117 older adults (average age, 75y), up to a 7yr follow-up. In 543 men, homocysteine was not associated with ACM risk. In 574 women, 1.7 to 1.9-fold higher ACM risk when comparing  > 12.7 and >15.6 vs < 10.3 uMol.

Not included in their analysis:

  • Petersen et al. 2016: 670 subjects, average age 65y, average follow-up 14.5y. Subjects with homocysteine values ≥ 10.8 μmol/l  had a significant higher incidence of all-cause mortality:

hcy 2

In sum, the evidence appears consistent across these 12 studies that elevated homocysteine is associated with an increased risk of death from all causes. Based on the Fan et al. (2016) meta-analysis, lower appears better, with values < 5 uMol associated with maximally reduced ACM risk. Also based on that data, my ACM risk is ~1.5-fold increased!

To see how dietary changes and supplements have impacted my homocysteine levels, see this link: https://michaellustgarten.wordpress.com/2018/03/23/reducing-homocysteine-updates/

If you’re interested, please have a look at my book:

References:

Bostom AG, Silbershatz H, Rosenberg IH, Selhub J, D’Agostino RB, Wolf PA, Jacques PF, Wilson PW. Nonfasting plasma total homocysteine levels and all-cause and cardiovascular disease mortality in elderly Framingham men and women. Arch Intern Med. 1999 May 24;159(10):1077-80.

Dangour AD, Breeze E, Clarke R, Shetty PS, Uauy R, Fletcher AE. Plasma homocysteine, but not folate or vitamin B-12, predicts mortalityin older people in the United Kingdom. J Nutr. 2008 Jun;138(6):1121-8.

Fan R, Zhang A, Zhong F. Association between Homocysteine Levels and All-cause Mortality: A Dose-Response Meta-Analysis of Prospective Studies. Sci Rep. 2017 Jul 6;7(1):4769.

González S, Huerta JM, Fernández S, Patterson AM, Lasheras C. Homocysteine increases the risk of mortality in elderly individuals. Br J Nutr. 2007 Jun;97(6):1138-43.

Hoogeveen EK, Kostense PJ, Jakobs C, Dekker JM, Nijpels G, Heine RJ, Bouter LM, Stehouwer CD. Hyperhomocysteinemia increases risk of death, especially in type 2 diabetes : 5-year follow-up of the Hoorn Study. Circulation. 2000 Apr 4;101(13):1506-11.

Kark JD, Selhub J, Adler B, Gofin J, Abramson JH, Friedman G, Rosenberg IH. Nonfasting plasma total homocysteine level and mortality in middle-aged and elderly men and women in Jerusalem. Ann Intern Med. 1999 Sep 7;131(5):321-30.

Petersen JF, Larsen BS, Sabbah M, Nielsen OW, Kumarathurai P, Sajadieh A. Long-term prognostic significance of homocysteine in middle-aged and elderly. Biomarkers. 2016 Sep;21(6):490-6.

Swart KM, van Schoor NM, Blom HJ, Smulders YM, Lips P. Homocysteine and the risk of nursing home admission and mortality in older persons. Eur J Clin Nutr. 2012 Feb;66(2):188-95.

Waśkiewicz A, Sygnowska E, Broda G. Homocysteine concentration and the risk of death in the adult Polish population. Kardiol Pol. 2012;70(9):897-902.

Wong YY, Almeida OP, McCaul KA, Yeap BB, Hankey GJ, Flicker L. Homocysteine, frailty, and all-cause mortality in older men: the health in men study. J Gerontol A Biol Sci Med Sci. 2013 May;68(5):590-8.

Vollset SE, Refsum H, Tverdal A, Nygård O, Nordrehaug JE, Tell GS, Ueland PM. Plasma total homocysteine and cardiovascular and noncardiovascular mortality: the Hordaland Homocysteine Study. Am J Clin Nutr. 2001 Jul;74(1):130-6.

Interpreting Blood Test Results (Serum Bicarbonate): What’s Optimal?

My approach to optimizing health and lifespan includes daily nutrient tracking and yearly blood testing. Once you get your blood test results back from the doctor, are your values optimal if you’re within the reference range? This article will examine the “optimal range” for 1 of these measurements, serum bicarbonate.

What does serum bicarbonate measure? The amount of bicarbonate in the blood is indicative of dietary acid load (Adeva and Souto 2011), systemic metabolism, lung and kidney function. First, a diet rich in animal products and grains (acid-forming), and poor in fruits and vegetables (base-forming) can induce a state of metabolic acidosis (Sebastian et al. 2001). Similarly, cellular metabolism produces carbon dioxide (CO2), a gas that is an acid. The lungs and kidneys act to remove systemic increases in acid load: CO2 reacts with water to form bicarbonate (H2CO3-), where it travels to the lung for excretion by exhaling it as CO2. The kidneys decrease acid load (whether from the diet or metabolism) by removing protons (H+) from the blood, followed by urinating the acid out of the body, and also by producing bicarbonate. In sum, serum bicarbonate is a measure of acid load: from the diet, by your body’s ability to produce it, by your kidney’s ability to buffer it, and by your lungs ability to remove it.

Low serum bicarbonate is indicative of increased systemic acidity, whereas a high serum bicarbonate indicates systemic alkalinity. If systemic acidity is high, bicarbonate will be consumed to neutralize the acid, thereby decreasing serum bicarbonate. Assuming that bicarbonate is not being consumed in the diet (via fruits and vegetables), the kidney would have to then produce bicarbonate to make up for the increase in bicarbonate consumption.

The reference range for serum bicarbonate is 20-30 mEq/L. My average serum bicarbonate value (y-axis) in 18 blood tests from 2015-2019 is 26.7 mEq/L (red line below):

bicarb.png

Also note that there is a weak trend (black line, R2=0.077) for my serum bicarbonate values to decrease over time.

Sure, these values are within the reference range, but what’s optimal?

In a study that included 31,590 subjects with average age of ~50 years, an average BMI <25 kg/m2, and a median follow up ~8 years, a serum bicarbonate value < 26 mEq/L, compared with 31 mEq/L, had a 46% significantly increased all-cause mortality risk (see below; Park et al. 2015).

bc 2

In contrast to these data, shown below are the findings of Raphael et al. 2013, who found no association between serum bicarbonate with mortality risk. In that study, 15,836 overweight (the BMI range average was from 26-29) subjects with an average age ~43 years were followed for ~9 years. Although an acidic serum bicarbonate value (<22, compared with 26-30 mEq/Las the reference) was associated with a 75% increased all-cause mortality risk, when excluding subjects with CKD from the analysis, that association was no longer statistically significant. However, it is important to note a similar trend (albeit non-significant) of association between acidic serum bicarbonate values with an increased mortality risk was present in those that did not have CKD.

stud2

Note that these 2 studies were performed in adults that were close to middle-age (43y, 50y). What does the data look like in older adults? In a study of 2,287 older adults (average age, 76y, Raphael et al. 2016), serum bicarbonate values less than 23 mEq/L were associated with significantly worse survival over a 10-year follow-up, when compared with values between 23-27.9 mEq/L. Also note that although survival looks worse for those that had bicarbonate values > 28 mEq/L, these data were not significantly different when compared with the 23-27 mEq/L group:

Screen Shot 2019-07-14 at 11.52.55 AM

In addition, lower values for serum bicarbonate in older adults are associated with an increased risk for future physical function limitation (Yenchek et al. 2014). In a study of 1,544 overweight (BMI ~27 kg/m2) older adults (average age, ~75 years), subjects that had lower values for serum bicarbonate (< 25.9 mEq/L) had an increased risk for future functional limitation over a 4-year follow-up period, when compared with subjects with that had higher values (greater than 26 mEq/L). It is important to note that age-related decreased kidney function leads to an inability to produce bicarbonate, thereby decreasing serum bicarbonate. However, after adjusting for the presence or absence of subjects with chronic kidney disease (CKD), the association between a more acidic serum bicarbonate value with future functional limitation remained. In other words, poor kidney function was not driving the effect of acidosis on risk for future functional limitation.

Screen Shot 2019-07-14 at 12.13.49 PM.png

Collectively, these data suggest that higher values for serum bicarbonate (> 26 mEq/L) may be optimal for health and longevity. When considering this, my average bicarbonate value of 26.7 mEq/L seems ok, for now. Note that in my data above, there is a weak trend toward lower values. I’m aware of it, and it continues to decrease over time, I’ll intervene!


If you’re interested, please have a look at my book!


References

Adeva MM, Souto G. Diet-induced metabolic acidosis. Clin Nutr. 2011 Aug;30(4):416-21.

Park M, Jung SJ, Yoon S, Yun JM, Yoon HJ. Association between the markers of metabolic acid load and higher all-cause and cardiovascular mortality in a general population with preserved renal function. Hypertens Res. 2015 Jun;38(6):433-8.

Raphael KL, Zhang Y, Wei G, Greene T, Cheung AK, Beddhu S. Serum bicarbonate and mortality in adults in NHANES III. Nephrol Dial Transplant. 2013 May;28(5):1207-13.

Raphael KL, Murphy RA, Shlipak MG, Satterfield S, Huston HK, Sebastian A, Sellmeyer DE, Patel KV, Newman AB, Sarnak MJ, Ix JH, Fried LF; Health ABC Study Bicarbonate Concentration, Acid-Base Status, and Mortality in the Health, Aging, and Body Composition Study. Clin J Am Soc Nephrol. 2016 Feb 5;11(2):308-16.

Sebastian A, Frassetto LA, Sellmeyer DE, Merriam RL, Morris RC Jr. Estimation of the net acid load of the diet of ancestral preagricultural Homo sapiens and their hominid ancestors. Am J Clin Nutr. 2002 Dec;76(6):1308-16.

Yenchek R, Ix JH, Rifkin DE, Shlipak MG, Sarnak MJ, Garcia M, Patel KV, Satterfield S, Harris TB, Newman AB, Fried LF; Health, Aging, and Body Composition Study. Association of serum bicarbonate with incident functional limitation in older adults. Clin J Am Soc Nephrol. 2014 Dec 5;9(12):2111-6.