Join us on Patreon!
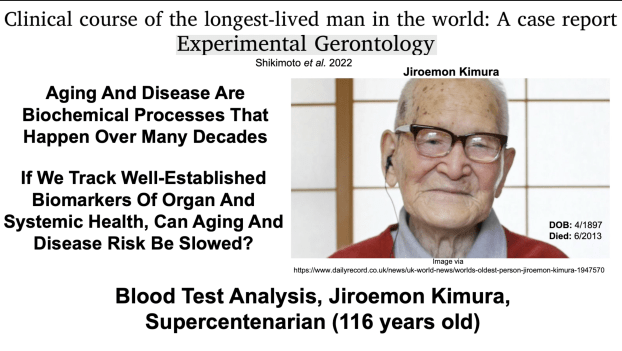
Supercentenarian (112 – 116y) Blood Test Analysis
Leave a reply
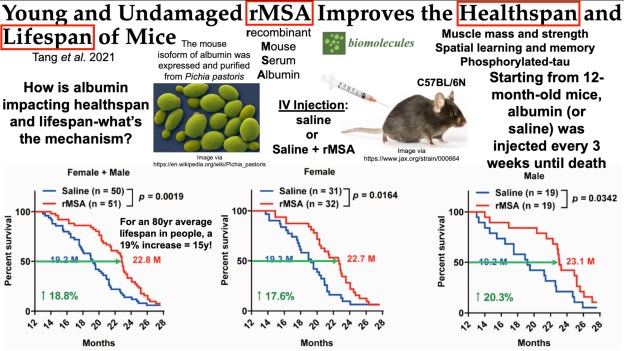
Paper review for “Young and Undamaged rMSA Improves the Healthspan andLifespan of Mice”
https://pubmed.ncbi.nlm.nih.gov/34439857/
Join us on Patreon!

Papers referenced in the video: DNA methylation
GrimAge strongly predicts lifespan and healthspan:
https://pubmed.ncbi.nlm.nih.gov/30669…
GrimAge outperforms other epigenetic clocks in the prediction of age-related clinical phenotypes and all-cause mortality:
https://pubmed.ncbi.nlm.nih.gov/33211…
Dietary intake and blood concentrations of antioxidants and the risk of cardiovascular disease, total cancer, and all-cause mortality: a systematic review and dose-response meta-analysis of prospective studies: https://pubmed.ncbi.nlm.nih.gov/30475…
Albumin is included as a biological age predictor:
https://www.ncbi.nlm.nih.gov/pmc/arti…
https://www.ncbi.nlm.nih.gov/pmc/arti…
https://www.ncbi.nlm.nih.gov/pmc/arti…
https://pubmed.ncbi.nlm.nih.gov/30993…
Age-related change data for albumin:
https://pubmed.ncbi.nlm.nih.gov/26071…
Associations of cardiovascular biomarkers and plasma albumin with exceptional survival to the highest ages: https://www.nature.com/articles/s4146…
On my latest blood test (August 2015), my total cholesterol was 127 mg/dL-is that value optimal for health and longevity?
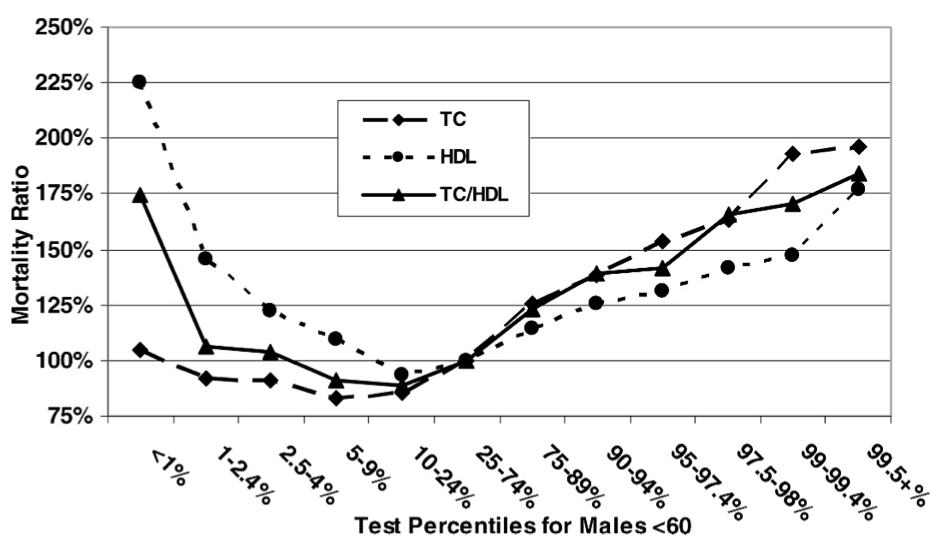
Based on data for 1,104,294 men younger than 60y (median age, 40y) that were followed for up to 14 years (Fulks et al. 2009), my 127 mg/dL value (1 – 2.4%) puts me relatively close to maximally reduced all-cause mortality risk, which occurs at 146-158 mg/dL (5-9% on the graph below):
But what about the data for men older than 60?
In a 10-year study of 2,277 older adults (average age, ~77y), total cholesterol levels less than 175 mg/dL were associated with ~2-fold higher risk of all-cause mortality, compared with values greater than 226 mg/dL (Schupf et al. 2005):

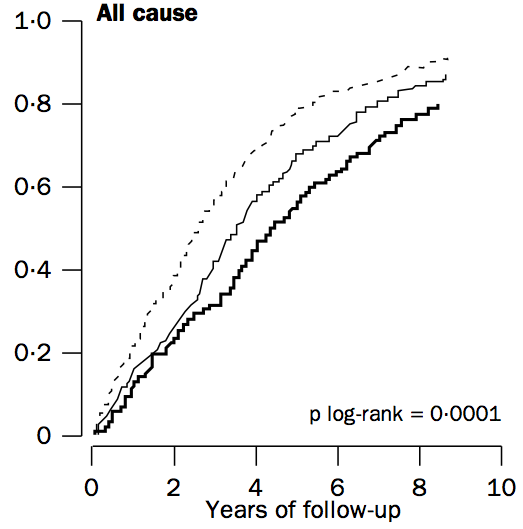
Similarly, in a 10-year study of even older adults (median age, 89y; 724 subjects), all-cause mortality risk was significantly increased in subjects with total cholesterol values less than 193 mg/dL (dark black line below), compared with values greater than 251 mg/dL (dashed line; Weverling-Rijnsburger et al. 1997). In addition, subjects with cholesterol values greater than 251 mg/dL lived ~2 years longer than those with values less than 191 mg/dL. So higher cholesterol in very old adults…increased lifespan! Does that mean I should alter my dietary approach to increase my circulating cholesterol levels after I reach 60?
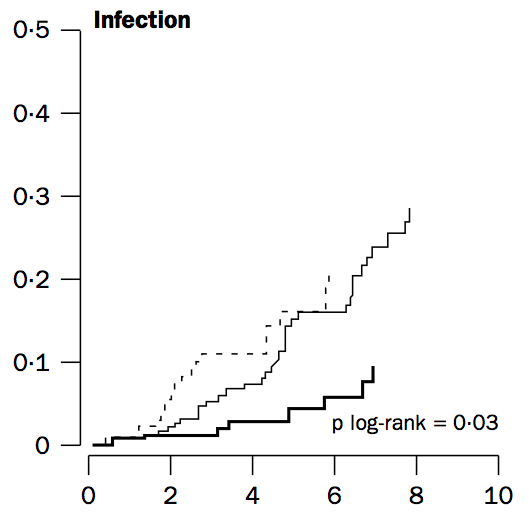
To address that issue, it’s important to understand why cholesterol increases during aging. One possible mechanism involves the role of cholesterol in immune defense against infectious agents (bacteria, viruses, parasites, etc.). Obviously, our immune system is supposed to eliminate these pathogens, but immune function decreases with age (Targonski et al. 2007). As a compensatory mechanism, cholesterol can protect against infectious agents. For example, LDL cholesterol binds to and partially inactivates Staphylococcus aureus (Bhakdi et al. 1983). Staphylococcus aureus infection increases during aging, as its incidence rate is ~3-fold higher in adults older than 60y, when compared with younger subjects (Laupland et al. 2008). In addition, LDL cholesterol inhibits bacterial endotoxin (Weinstock et al. 1992), whose presence in the blood increases during aging (Ghosh et al. 2015). In support of the link between circulating cholesterol with infectious agents, in the older adults of Weverling-Rijnsburger et al. (1997), cholesterol values greater than 251 mg/dL (solid black line) were associated with significantly decreased infectious disease-related mortality, when compared with values less than 193 mg/dL:
So if we’re better able to keep infectious agents out of our blood, that would be expected to reduce the need for elevated circulating cholesterol during aging. How can we do that?
One approach involves increased dietary fiber. Fermentation of dietary fiber by gut bacteria produces short-chain fatty acids, which improve gut barrier function (Chen et al. 2013), and decrease cholesterol synthesis (Wright et al. 1990). However, older adults do not eat high-fiber diets, as values of only ~19g/day have been reported (Lustgarten et al. 2014). In contrast, dietary fiber intakes greater than only 29g/day are associated with less infectious disease (and all-cause mortality) risk (Park et al. 2011). So definitely eating at least 29g fiber/day is important, but is that amount optimal to minimize the need for elevated cholesterol during aging?
In a 2-week study of the role of dietary fiber on circulating cholesterol, subjects that ate only 10g fiber/1000 calories did not significantly reduce their baseline total cholesterol values from ~182 mg/dL (Jenkins et al. 2001). In contrast, a dietary fiber intake of 19g/1000 calories reduced baseline total cholesterol from 185 to 150 mg/dL, and subjects that ate even more fiber than that, 55g/1000 calories reduced their total cholesterol values from ~182 to 142 mg/dL, a drop that was also significantly different compared with the 19g fiber/1000 calorie group.
Collectively, these data suggest that to maximally boost gut barrier function, thereby minimizing circulating infectious agents and the need for elevated circulating cholesterol during aging, a very-high fiber-diet may be important. Accordingly, my average daily fiber intake is ~100 g/day on a 2300 calorie diet, resulting in ~43g fiber/1000 calories. Based on this, I don’t expect for my total cholesterol values to change during aging, as my gut barrier function will be optimal, and infectious agents in my blood will be minimized.
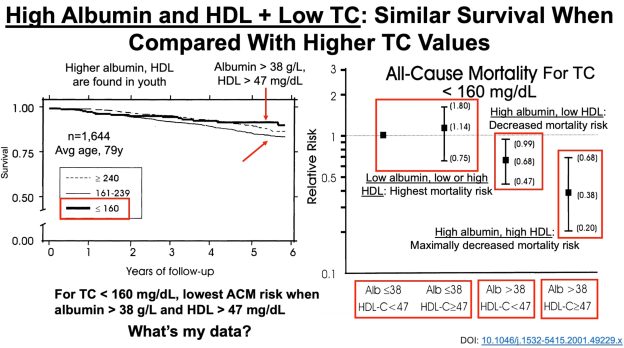
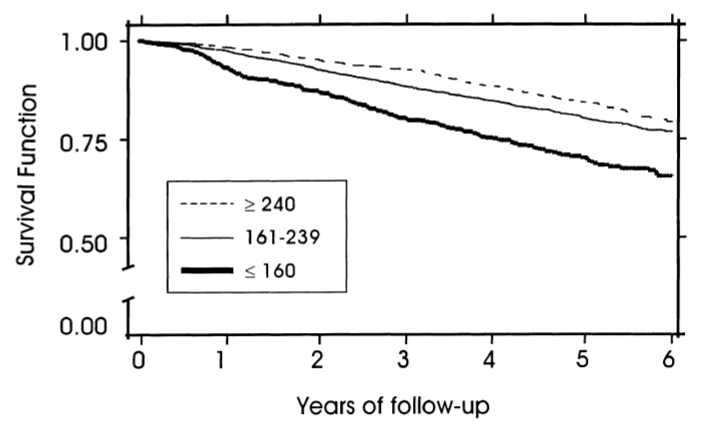
To add some specificity to this approach, 2 additional measurements may be important: serum albumin and HDL cholesterol. In agreement with the studies of Weverling-Rijnsburger et al. and Schupf et al., in a 5-year study of 4,128 older adults (average age, ~79y), those with total cholesterol values less than 160 mg/dL had significantly higher all-cause mortality risk, compared with values greater than 240 mg/dL (Volpato et al. 2001):
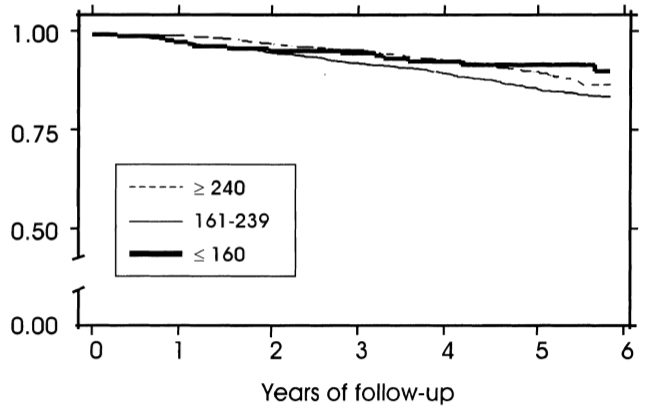
However, when considering subjects’ albumin and HDL cholesterol levels, the differential mortality risk was abolished. Subjects that had low total cholesterol but also high (within-range) albumin and HDL had improved survival compared to the higher cholesterol groups:
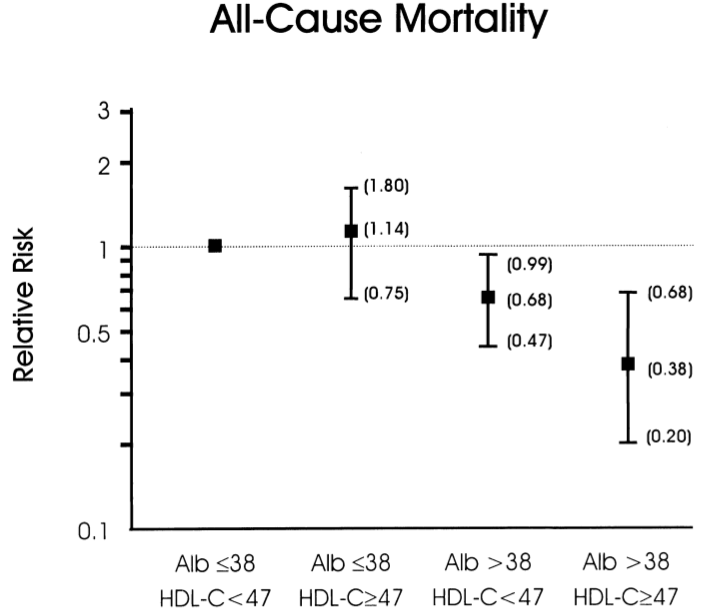
If your total cholesterol values are less than 160 mg/dL, what serum albumin and HDL values should you shoot for? As shown below, albumin levels greater than 38 g/L and HDL values greater than 47 mg/dL were associated with maximally reduced all-cause mortality risk in subjects with total cholesterol values less than 160 mg/dL (Volpato et al. 2001):
8/15/2020: Video update!
If you’re interested, please have a look at my book!
References
Bhakdi S, Tranum-Jensen J, Utermann G, Füssle R. Binding and partial inactivation of Staphylococcus aureus alpha-toxin by human plasma low density lipoprotein. J Biol Chem. 1983 May 10;258(9):5899-904.
Chen H, Mao X, He J, Yu B, Huang Z, Yu J, Zheng P, Chen D. Dietary fibre affects intestinal mucosal barrier function and regulates intestinal bacteria in weaning piglets. Br J Nutr. 2013 Nov;110(10):1837-48.
Eaton SB, Eaton SB 3rd, Konner MJ. Paleolithic nutrition revisited: A twelve-year retrospective on its nature and implications. Eur J Clin Nutr. 1997 Apr;51(4):207-16.
Fulks M, Stout RL, Dolan VF. Association of cholesterol, LDL, HDL, cholesterol/ HDL and triglyceride with all-cause mortality in life insurance applicants. J Insur Med. 2009;41(4):244-53.
Ghosh S, Lertwattanarak R, Garduño Jde J, Galeana JJ, Li J, Zamarripa F, Lancaster JL, Mohan S, Hussey S, Musi N. Elevated muscle TLR4 expression and metabolic endotoxemia in human aging. J Gerontol A Biol Sci Med Sci. 2015 Feb;70(2):232-46.
Jenkins DJ, Kendall CW, Popovich DG, Vidgen E, Mehling CC, Vuksan V, Ransom TP, Rao AV, Rosenberg-Zand R, Tariq N, Corey P, Jones PJ, Raeini M, Story JA, Furumoto EJ, Illingworth DR, Pappu AS, Connelly PW. Effect of a very-high-fiber vegetable, fruit, and nut diet on serum lipids and colonic function. Metabolism. 2001 Apr;50(4):494-503.
Laupland KB, Ross T, Gregson DB. Staphylococcus aureus bloodstream infections: risk factors, outcomes, and the influence of methicillin resistance in Calgary, Canada, 2000-2006. J Infect Dis. 2008 Aug 1;198(3):336-43.
Lustgarten MS, Price LL, Chalé A, Fielding RA. Metabolites related to gut bacterial metabolism, peroxisome proliferator-activated receptor-alpha activation, and insulin sensitivity are associated with physical function in functionally-limited older adults. Aging Cell. 2014 Oct;13(5):918-25.
Mansoor N, Vinknes KJ, Veierød MB, Retterstøl K. Effects of low-carbohydrate diets v. low-fat diets on body weight and cardiovascular risk factors: a meta-analysis of randomised controlled trials. Br J Nutr. 2016 Feb;115(3):466-79.
Park Y, Subar AF, Hollenbeck A, Schatzkin A. Dietary fiber intake and mortality in the NIH-AARP diet and health study. Arch Intern Med. 2011 Jun 27;171(12):1061-8.
Schmutz EA, Zimmermann MB, Rohrmann S. The inverse association between serum 25-hydroxyvitamin D and mortality may be modified by vitamin A status and use of vitamin A supplements. Eur J Nutr. 2016 Feb;55(1):393-402.
Schupf N, Costa R, Luchsinger J, Tang MX, Lee JH, Mayeux R. Relationship Between Plasma Lipids and All-Cause Mortality in Nondemented Elderly. J Am Geriatr Soc. 2005 Feb;53(2):219-26.
Targonski PV, Jacobson RM, Poland GA. Immunosenescence: role and measurement in influenza vaccine response among the elderly. Vaccine. 2007 Apr 20;25(16):3066-9.
Vasto S, Scapagnini G, Rizzo C, Monastero R, Marchese A, Caruso C. Mediterranean diet and longevity in Sicily: survey in a Sicani Mountains population. Rejuvenation Res. 2012 Apr;15(2):184-8.
Volpato S, Leveille SG, Corti MC, Harris TB, Guralnik JM. The value of serum albumin and high-density lipoprotein cholesterol in defining mortality risk in older persons with low serum cholesterol. J Am Geriatr Soc. 2001 Sep;49(9):1142-7.
Weinstock C, Ullrich H, Hohe R, Berg A, Baumstark MW, Frey I, Northoff H, Flegel WA. Low density lipoproteins inhibit endotoxin activation of monocytes. Arterioscler Thromb. 1992 Mar;12(3):341-7.
Weverling-Rijnsburger AW, Blauw GJ, Lagaay AM, Knook DL, Meinders AE, Westendorp RG. Total cholesterol and risk of mortality in the oldest old. Lancet. 1997 Oct 18;350(9085):1119-23.
Wright RS, Anderson JW, Bridges SR. Propionate inhibits hepatocyte lipid synthesis. Proc Soc Exp Biol Med. 1990 Oct;195(1):26-9.

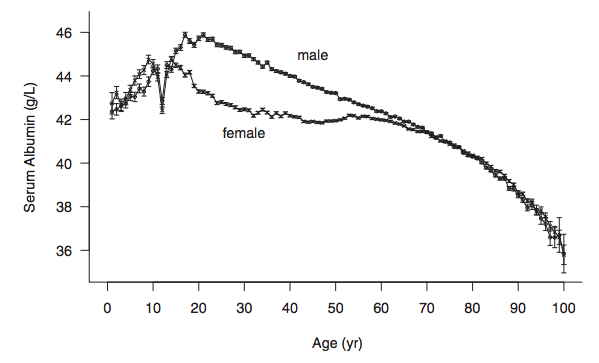
Levels of serum albumin peak at about 20 years old (~4.6 g/dL for males, ~4.4 g/dL for females), then decrease during aging, as shown for the 1,079,193 adults of Weaving et al. (2016):
Similar age-related decreases for serum albumin albumin have also been reported in smaller studies: Gom et al. 2007 (62,854 subjects); Dong et al. 2010 (2,364 subjects); Le Couteur et al. 2010 (1,673 subjects); Dong et al. 2012 (1,489 subjects).
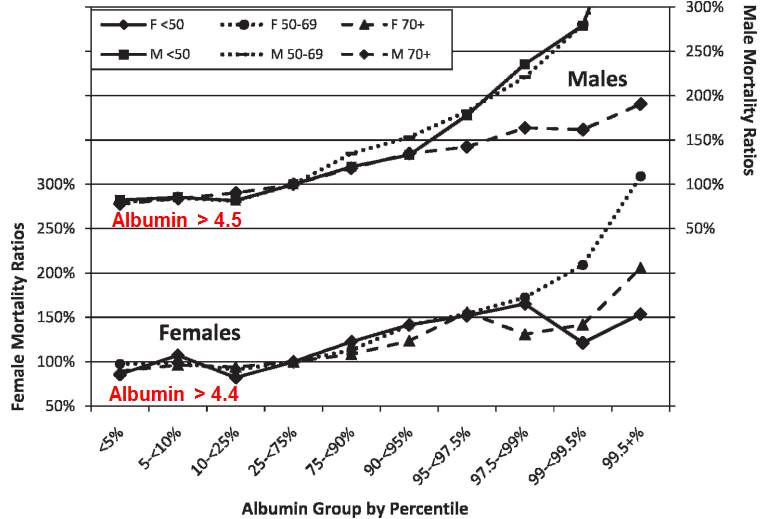
Why is it important that serum levels of albumin decrease during aging? Reduced levels of albumin are associated with an increased risk of death from all causes. For example, in the 1,704,566 adults of Fulks et al. 2010, serum albumin levels > 4.4 g/dL and 4.5 g/dL for females and males, respectively, were associated with maximally reduced risk of death from all causes, regardless of age (younger than 50y, 50-69y, or 70y+):
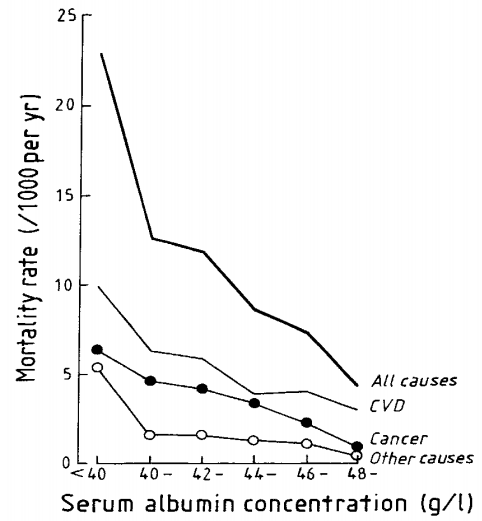
The association between reduced levels of serum albumin with an increased risk of death from all causes have also been found in smaller studies. In a ~9 year study of 7,735 men (age range, 40-59y), when serum albumin was less than 4 g/dL, the mortality rate was 23/1000/per year, compared with 4/1000/per year for subjects with values greater than 4.8 g/dL (Phillips et al. 1989):
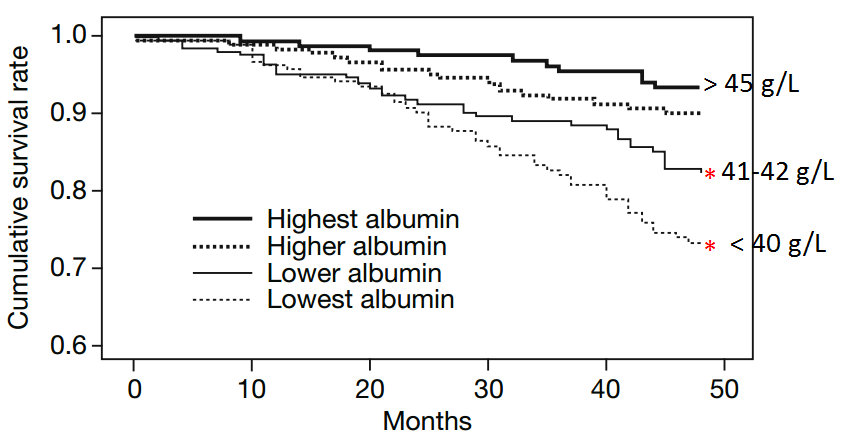
Similarly, in older adults (average age, ~80y, 672 subjects), serum albumin levels greater than 4.5 g/dL (equivalent to 45 g/L) were associated with significantly reduced all-cause mortality risk, when compared with compared with < 4.1 g/dL (equivalent to 41 g/L, Takata et al. 2010):
Decreased levels of serum albumin (less than 4 g/dL) being associated with an increased all-cause mortality risk was also identified in a 12-year study of 287 older adults (average age, ~75y, Sahyoun et al. 1996).
Can the age-related decrease in serum albumin be minimized, or prevented? Shown below is my data for serum albumin since 2005, when I was 32y:
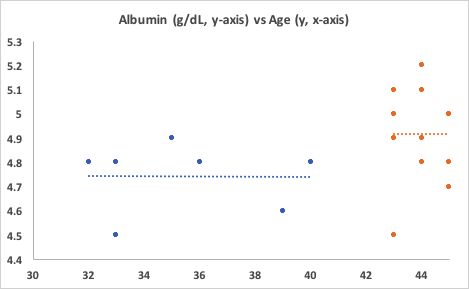
First, note the period from when I was 32y until 40y. No age-related decrease! My average albumin value over 7 measurements was 4.74 g/dL. Unfortunately, I didn’t track my dietary info during that time.
Also note the period from 43y to 45y. First, my albumin levels are significantly higher than the first period, 4.92 g/dL (p=0.027)! Second, again note the absence of an age-related decrease. Based on the data of Weaving et al. (2016), my albumin levels should be around 4.4 g/dL, but I’ve got them going in the opposite direction! How have I been able to do that?
Since April 2015, with use of a food scale, I’ve been tracking my daily dietary intake, including macro and micronutrients (54 variables). For each orange data point in the second period, I have an average dietary intake for each of the 54 variables that I can use to correlate with serum albumin. Based on that data, I can make an educated guess at what could potentially increase, or decrease it.
Of the 54 dietary variables that I track, only 3 were significantly correlated with albumin: positive associations for alpha-carotene (r = 0.66, p = 0.027), beta-carotene (r = 0.75, p =0.007), and a negative association for Vitamin K (r = -0.64, p = 0.03). Shown below is the strongest correlation of the three, beta-carotene, vs. serum albumin.
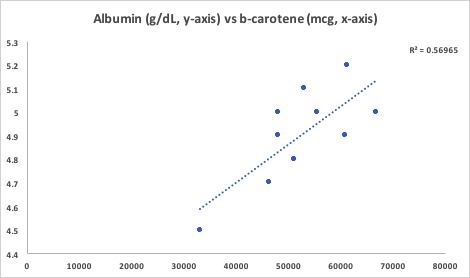
The majority of my alpha and beta-carotene intake comes from carrots, with a smaller amount coming from butternut squash. Interestingly, beta-cryptoxanthin, a Vitamin A metabolite that is abundant in butternut squash, was not significantly associated with serum albumin. Butternut squash is also a good source of alpha- and beta-carotene, so if butternut squash was driving the correlation between the carotenes with albumin, I’d expect beta-crypoxanthin to also be significantly associated with it. However, since it’s not, carrots are the most likely source driving the association. Also note that the my average intake of Vitamin K is dramatically higher (1410 mcg; range, 1080-2203 mcg) than the RDA or AI, which are ~100-120 mcg/day. The negative association between my Vitamin K intake with albumin suggests that I should keep it closer to 1100 mcg/day to potentially keep my albumin levels high.
If you’re interested, please have a look at my book!
References
Dong MH, Bettencourt R, Barrett-Connor E, Loomba R. Alanine aminotransferase decreases with age: the Rancho Bernardo Study. PLoS One. 2010 Dec 8;5(12):e14254.
Dong MH, Bettencourt R, Brenner DA, Barrett-Connor E, Loomba R. Serum levels of alanine aminotransferase decrease with age in longitudinal analysis. Clin Gastroenterol Hepatol. 2012 Mar;10(3):285-90.e1.
Gom I, Fukushima H, Shiraki M, Miwa Y, Ando T, Takai K, Moriwaki H. Relationship between serum albumin level and aging in community-dwelling self-supported elderly population. J Nutr Sci Vitaminol (Tokyo). 2007 Feb;53(1):37-42.
Dong MH, Bettencourt R, Barrett-Connor E, Loomba R. Alanine aminotransferase decreases with age: the Rancho Bernardo Study. PLoS One. 2010 Dec 8;5(12):e14254.
Fulks M, Stout RL, Dolan VF. Albumin and all-cause mortality risk in insurance applicants. J Insur Med. 2010;42(1):11-7.
Le Couteur DG, Blyth FM, Creasey HM, Handelsman DJ, Naganathan V, Sambrook PN, Seibel MJ, Waite LM, Cumming RG. The association of alanine transaminase with aging, frailty, and mortality. J Gerontol A Biol Sci Med Sci. 2010 Jul;65(7):712-7.
Phillips A, Shaper AG, Whincup PH. Association between serum albumin and mortality from cardiovascular disease, cancer, and other causes. Lancet. 1989 Dec 16;2(8677):1434-6.
Sahyoun NR, Jacques PF, Dallal G, Russell RM. Use of albumin as a predictor of mortality in community dwelling and institutionalized elderly populations. J Clin Epidemiol. 1996 Sep;49(9):981-8.
Takata Y, Ansai T, Soh I, Awano S, Sonoki K, Akifusa S, Kagiyama S, Hamasaki T, Torisu T, Yoshida A, Nakamichi I, Takehara T. Serum albumin levels as an independent predictor of 4-year mortality in a community-dwelling 80-year-old population. Aging Clin Exp Res. 2010 Feb;22(1):31-5.
Weaving G, Batstone GF, Jones RG. Age and sex variation in serum albumin concentration: an observational study. Ann Clin Biochem. 2016 Jan;53(Pt 1):106-11.
On my latest blood test (August 2015), my total cholesterol was 127 mg/dL-is that value optimal for health and longevity?
Based on data for 1,104,294 men younger than 60y (median age, 40y) that were followed for up to 14 years (Fulks et al. 2009), my 127 mg/dL value (1 – 2.4%) puts me relatively close to maximally reduced all-cause mortality risk, which occurs at 146-158 mg/dL (5-9% on the graph below):
But what about the data for men older than 60?
In a 10-year study of 2,277 older adults (average age, ~77y), total cholesterol levels less than 175 mg/dL were associated with ~2-fold higher risk of all-cause mortality, compared with values greater than 226 mg/dL (Schupf et al. 2005):
Similarly, in a 10-year study of even older adults (median age, 89y; 724 subjects), all-cause mortality risk was significantly increased in subjects with total cholesterol values less than 193 mg/dL (dark black line below), compared with values greater than 251 mg/dL (dashed line; Weverling-Rijnsburger et al. 1997). In addition, subjects with cholesterol values greater than 251 mg/dL lived ~2 years longer than those with values less than 191 mg/dL. So higher cholesterol in very old adults…increased lifespan! Does that mean I should alter my dietary approach to increase my circulating cholesterol levels after I reach 60?
To address that issue, it’s important to understand why cholesterol increases during aging. One possible mechanism involves the role of cholesterol in immune defense against infectious agents (bacteria, viruses, parasites, etc.). Obviously, our immune system is supposed to eliminate these pathogens, but immune function decreases with age (Targonski et al. 2007). As a compensatory mechanism, cholesterol can protect against infectious agents. For example, LDL cholesterol binds to and partially inactivates Staphylococcus aureus (Bhakdi et al. 1983). Staphylococcus aureus infection increases during aging, as its incidence rate is ~3-fold higher in adults older than 60y, when compared with younger subjects (Laupland et al. 2008). In addition, LDL cholesterol inhibits bacterial endotoxin (Weinstock et al. 1992), whose presence in the blood increases during aging (Ghosh et al. 2015). In support of the link between circulating cholesterol with infectious agents, in the older adults of Weverling-Rijnsburger et al. (1997), cholesterol values greater than 251 mg/dL (solid black line) were associated with significantly decreased infectious disease-related mortality, when compared with values less than 193 mg/dL:
So if we’re better able to keep infectious agents out of our blood, that would be expected to reduce the need for elevated circulating cholesterol during aging. How can we do that?
One approach involves increased dietary fiber. Fermentation of dietary fiber by gut bacteria produces short-chain fatty acids, which improve gut barrier function (Chen et al. 2013), and decrease cholesterol synthesis (Wright et al. 1990). However, older adults do not eat high-fiber diets, as values of only ~19g/day have been reported (Lustgarten et al. 2014). In contrast, dietary fiber intakes greater than only 29g/day are associated with less infectious disease (and all-cause mortality) risk (Park et al. 2011). So definitely eating at least 29g fiber/day is important, but is that amount optimal to minimize the need for elevated cholesterol during aging?
In a 2-week study of the role of dietary fiber on circulating cholesterol, subjects that ate only 10g fiber/1000 calories did not significantly reduce their baseline total cholesterol values from ~182 mg/dL (Jenkins et al. 2001). In contrast, a dietary fiber intake of 19g/1000 calories reduced baseline total cholesterol from 185 to 150 mg/dL, and subjects that ate even more fiber than that, 55g/1000 calories reduced their total cholesterol values from ~182 to 142 mg/dL, a drop that was also significantly different compared with the 19g fiber/1000 calorie group.
Collectively, these data suggest that to maximally boost gut barrier function, thereby minimizing circulating infectious agents and the need for elevated circulating cholesterol during aging, a very-high fiber-diet may be important. Accordingly, my average daily fiber intake is ~100 g/day on a 2300 calorie diet, resulting in ~43g fiber/1000 calories. Based on this, I don’t expect for my total cholesterol values to change during aging, as my gut barrier function will be optimal, and infectious agents in my blood will be minimized.
To add some specificity to this approach, 2 additional measurements may be important: serum albumin and HDL cholesterol. In agreement with the studies of Weverling-Rijnsburger et al. and Schupf et al., in a 5-year study of 4,128 older adults (average age, ~79y), those with total cholesterol values less than 160 mg/dL had significantly higher all-cause mortality risk, compared with values greater than 240 mg/dL (Volpato et al. 2001):
However, when considering subjects’ albumin and HDL cholesterol levels, the differential mortality risk was abolished. Subjects that had low total cholesterol but also high (within-range) albumin and HDL had improved survival compared to the higher cholesterol groups:
If your total cholesterol values are less than 160 mg/dL, what serum albumin and HDL values should you shoot for? As shown below, albumin levels greater than 38 g/L and HDL values greater than 47 mg/dL were associated with maximally reduced all-cause mortality risk in subjects with total cholesterol values less than 160 mg/dL (Volpato et al. 2001):
My albumin values are consistently between 46-48 g/L, but during recent measurements my HDL levels have been lower than optimal (35 mg/dL on 8/2015). The good news is that I was able to increase my HDL from 28 (7/2013 measurement) to 35 mg/dL by adding ~4 oz of fish every day! To further increase my HDL, I’ve doubled my fish oil intake (~3.3 g of combined EPA + DHA per day, from 5-9 g of cod liver oil). I’ll test the effect of this on my circulating biomarkers in a couple of months, so stay tuned!
3/23/2016 Update: Because of concerns that the pre-formed Vitamin A (that is found in cod liver oil) may negate the potential health-promoting effects of optimal Vitamin D levels (Schmutz et al. 2016), I stopped taking cod liver oil during the 3-month period that preceded my latest blood test (3/23/2016). However, I was able to increase my HDL from 35 to 53 mg/dL! I attribute this increase to the daily inclusion of ~60g/walnuts per day. In doing that, although I only replaced ~200 calories from carbohydrates with fat, lower carbohydrate diets have been shown to increase HDL (Manor et al. 2016).
Nonetheless, in terms of the all-cause mortality data that includes total cholesterol (137 mg/dL), albumin (51 g/L), and HDL (53 mg/dL), based on my latest blood test results, my risk is now maximally low!
If you’re interested, please have a look at my book!
References
Bhakdi S, Tranum-Jensen J, Utermann G, Füssle R. Binding and partial inactivation of Staphylococcus aureus alpha-toxin by human plasma low density lipoprotein. J Biol Chem. 1983 May 10;258(9):5899-904.
Chen H, Mao X, He J, Yu B, Huang Z, Yu J, Zheng P, Chen D. Dietary fibre affects intestinal mucosal barrier function and regulates intestinal bacteria in weaning piglets. Br J Nutr. 2013 Nov;110(10):1837-48.
Eaton SB, Eaton SB 3rd, Konner MJ. Paleolithic nutrition revisited: A twelve-year retrospective on its nature and implications. Eur J Clin Nutr. 1997 Apr;51(4):207-16.
Fulks M, Stout RL, Dolan VF. Association of cholesterol, LDL, HDL, cholesterol/ HDL and triglyceride with all-cause mortality in life insurance applicants. J Insur Med. 2009;41(4):244-53.
Ghosh S, Lertwattanarak R, Garduño Jde J, Galeana JJ, Li J, Zamarripa F, Lancaster JL, Mohan S, Hussey S, Musi N. Elevated muscle TLR4 expression and metabolic endotoxemia in human aging. J Gerontol A Biol Sci Med Sci. 2015 Feb;70(2):232-46.
Jenkins DJ, Kendall CW, Popovich DG, Vidgen E, Mehling CC, Vuksan V, Ransom TP, Rao AV, Rosenberg-Zand R, Tariq N, Corey P, Jones PJ, Raeini M, Story JA, Furumoto EJ, Illingworth DR, Pappu AS, Connelly PW. Effect of a very-high-fiber vegetable, fruit, and nut diet on serum lipids and colonic function. Metabolism. 2001 Apr;50(4):494-503.
Laupland KB, Ross T, Gregson DB. Staphylococcus aureus bloodstream infections: risk factors, outcomes, and the influence of methicillin resistance in Calgary, Canada, 2000-2006. J Infect Dis. 2008 Aug 1;198(3):336-43.
Lustgarten MS, Price LL, Chalé A, Fielding RA. Metabolites related to gut bacterial metabolism, peroxisome proliferator-activated receptor-alpha activation, and insulin sensitivity are associated with physical function in functionally-limited older adults. Aging Cell. 2014 Oct;13(5):918-25.
Mansoor N, Vinknes KJ, Veierød MB, Retterstøl K. Effects of low-carbohydrate diets v. low-fat diets on body weight and cardiovascular risk factors: a meta-analysis of randomised controlled trials. Br J Nutr. 2016 Feb;115(3):466-79.
Park Y, Subar AF, Hollenbeck A, Schatzkin A. Dietary fiber intake and mortality in the NIH-AARP diet and health study. Arch Intern Med. 2011 Jun 27;171(12):1061-8.
Schmutz EA, Zimmermann MB, Rohrmann S. The inverse association between serum 25-hydroxyvitamin D and mortality may be modified by vitamin A status and use of vitamin A supplements. Eur J Nutr. 2016 Feb;55(1):393-402.
Schupf N, Costa R, Luchsinger J, Tang MX, Lee JH, Mayeux R. Relationship Between Plasma Lipids and All-Cause Mortality in Nondemented Elderly. J Am Geriatr Soc. 2005 Feb;53(2):219-26.
Targonski PV, Jacobson RM, Poland GA. Immunosenescence: role and measurement in influenza vaccine response among the elderly. Vaccine. 2007 Apr 20;25(16):3066-9.
Vasto S, Scapagnini G, Rizzo C, Monastero R, Marchese A, Caruso C. Mediterranean diet and longevity in Sicily: survey in a Sicani Mountains population. Rejuvenation Res. 2012 Apr;15(2):184-8.
Volpato S, Leveille SG, Corti MC, Harris TB, Guralnik JM. The value of serum albumin and high-density lipoprotein cholesterol in defining mortality risk in older persons with low serum cholesterol. J Am Geriatr Soc. 2001 Sep;49(9):1142-7.
Weinstock C, Ullrich H, Hohe R, Berg A, Baumstark MW, Frey I, Northoff H, Flegel WA. Low density lipoproteins inhibit endotoxin activation of monocytes. Arterioscler Thromb. 1992 Mar;12(3):341-7.
Weverling-Rijnsburger AW, Blauw GJ, Lagaay AM, Knook DL, Meinders AE, Westendorp RG. Total cholesterol and risk of mortality in the oldest old. Lancet. 1997 Oct 18;350(9085):1119-23.
Wright RS, Anderson JW, Bridges SR. Propionate inhibits hepatocyte lipid synthesis. Proc Soc Exp Biol Med. 1990 Oct;195(1):26-9.
