Category Archives: Diet and Mortality

Is Hesperidin Essential For Prophylaxis And Treatment Of COVID-19 Infection?

Wearing a mask, washing our hands, and social distancing are commonly recommended to slow the spread of SARS-CoV-2 infection. But, what about diet? In this video, I discuss the hypothesis that hesperidin, a metabolite found in lemons, oranges, and peppermint leaves, may contribute to the prevention and treatment of COVID-19.

Paper link: https://www.sciencedirect.com/science/article/pii/S030698772031358X

Blood Test Analysis In A 100 Year Old Subject

What are the blood biomarkers of a centenarian, and is there room for improvement? Find out in the video below!

Blood Testing: MCV, RDW. What’s Optimal for Health and Longevity?

Most often overlooked on a standard blood test are the mean corpuscular volume (MCW) and Red Blood Cell Distribution Width (RDW). How do they change during aging, and what’s associated with all-cause mortality risk? Also, with the goal of optimizing MCV and RDW, how does my diet correlate with these biomarkers?

Optimizing Biological Age-Lifespan.io Presentation

In the first 45 minutes, discuss each of the biomarkers contained within Levine’s Biological Age calculator, Phenotypic Age.

After that, I answer questions from the audience and we discuss all things related to aging.

https://www.youtube.com/watch?v=8hs2n7U7J-k&t=30s

Coronavirus: Can Diet Help?

There are a few ways that we can fight the novel coronavirus (SARS-CoV-2). Clinical trials aimed at vaccination have recently begun, and at the earliest, could be available within 6-18 months. Similarly, drugs aimed at inhibiting, blocking, or reducing viral replication, including remdesevir and hydoxychloroquine are entering clinical trials, but large-scale results are also a few months away.

Other alternatives that are rarely discussed are dietary components that can inhibit SARS-CoV-2 replication. Inhibiting replication is important because if the virus continually makes more copies of itself, there will be a systemic viral overload, thereby overwhelming the immune system. Two coronavirus proteins that are important for its replication and binding to cell membranes are its Main protease (Mpro for SARS-CoV-2, 3CLpro for SARS-CoV; X. Liu & Wang, 2020), and its surface Spike glycoprotein (S protein; Song et al. 2018), respectively.

In a recently published (but not peer-reviewed) preprint, Tallei et al. (2020) used a molecular docking approach to predict how SARS-CoV-2’s Mpro and S proteins interact with various drugs and plant-based compounds. A lower molecular docking value is indicative of a potentially better ability to inhibit these proteins. Interestingly, many plant-based metabolites have lower (or equal) molecular docking values when compared with coronavirus-based drugs:

Screen Shot 2020-04-11 at 9.34.42 AM

For example, when compared with the drugs nelfinavir, hyrdroxychloroquine sulfate, and chloroquine, hesperidin (found in citrus fruits and peppermint) and epigallocatechin galleate (found in green tea, apple skin, plums, onions, hazelnut) had equivalent or lower molecular docking scores, evidence that suggests a better ability for the plant-based metabolites to inhibit Mpro and the S protein. Based on this data, incorporation of these foods may be an important strategy for boosting endogenous defense against SARS-CoV-2 infection.

Similarly, a molecular docking approach was used to identify potential inhibitors for Mpro in another recent preprint (Khaerunnisa et al. 2020). When compared with the docking energy for Mpro’s native ligand (-8), the coronavirus drugs nelfinavir and lopinavir had lower docking energies, thereby suggesting that they would be good Mpro inhibitors. Interestingly, kaempferol and quercetin had docking energies that were not as low as the drugs, but were as low as or lower than the docking energy for Mpro’s native ligand, thereby suggesting that they might also act as inhibitors of SARS-CoV-2 replication:

Screen Shot 2020-04-11 at 10.26.50 AM

Kaempferol and quercetin are found in relatively high amounts in dill, lettuce, onions, spinach and other vegetables (for the full list see https://www.ars.usda.gov/ARSUserFiles/80400525/Data/Flav/Flav_R03.pdf).

It’s important to note that the amount of these foods needed to ingest enough kaempferol, quercetin, or other metabolites that may inhibit SARS-CoV-2 replication or its fusion to cell membranes proteins in vivo is unknown. In addition, with the goal of further boosting endogenous defense, I’d propose including these foods in addition to, but not for the replacement of  a vaccine or FDA approved medicines. Note that clinical trials aimed at direct testing for the ability of these plant-based components to inhibit SARS-CoV-2 replication has yet to be performed, but when consumed as a part of a whole-food diet, may be a low risk, high reward strategy for battling SARS-CoV-2 infection.

References

Khaerunnisa, S., Kurniawan, H., Awaluddin R., Suhartati S., Soetjipto, S. (2020). Potential Inhibitor of COVID-19 Main Protease (Mpro) from Several Medicinal Plant Compounds by Molecular Docking Study. March 13, Preprint. doi: 10.20944/preprints202003.0226.v1

Liu, X., & Wang, X.-J. (2020). Potential inhibitors for 2019-nCoV coronavirus M protease from clinically approved medicines. BioRxiv, 2020.01.29.924100. https://doi.org/10.1101/2020.01.29.924100.

Song, W., Gui, M., Wang, X., & Xiang, Y. (2018). Cryo-EM structure of the SARS coronavirus spike glycoprotein in complex with its host cell receptor ACE2. PLOS Pathogens, 14(8), e1007236. https://doi.org/10.1371/journal.ppat.1007236.

Tallei, T.E., Tumilaar, S.G., Niode, N.J. , Fatimawali, Kepel4, B.J., Idroes, R., Effendi Y.  (2020). Potential of Plant Bioactive Compounds as SARS-CoV-2 Main Protease (Mpro) and Spike (S) Glycoprotein Inhibitors: A Molecular Docking Study. April 9, Preprint. doi: 10.20944/preprints202004.0102.v2.

Coronavirus isn’t the only virus that negatively affects human health. For more info, 
https://www.amazon.com/dp/B01G48A88A


High-Fiber Diets Are Associated With Reduced All-Cause Mortality Risk

A meta-analysis of 10 studies, including 80,139 subjects was recently published that shows a significantly reduced risk of death for all causes in association with higher total dietary fiber intakes (35-39g/day), when compared with lower fiber (Reynolds et al. 2019):

Screen Shot 2020-01-26 at 12.15.51 PM


Should we supplement with fiber, or get it from whole food? Fiber from whole foods was significantly associated with lower levels of fasting glucose, body weight, whole body fat mass, LDL cholesterol, and triglycerides. Supplementation with fiber extracts or bran was not significantly associated with the reduction of any of these variables (NS, not significant; NM, not measured:

fiber


Reference

Reynolds A, Mann J, Cummings J, Winter N, Mete E, Te Morenga L. Carbohydrate quality and human health: a series of systematic reviews and meta-analyses. Lancet. 2019 Feb 2;393(10170):434-445. doi: 10.1016/S0140-6736(18)31809-9.


If you’re interested, please have a look a my book!

Uric acid: What’s optimal?

The reference range for uric acid is 4.0 – 8 mg/dL for men, and 2.5 – 7 mg/dL for women. Are these values optimal for health? To answer that question, let’s have a look at how circulating levels of uric acid change during aging, and their association with risk of death for all causes.

Uric acid increases during aging in both men and women. Kuzuya et al. (2002) studied how uric acid changes during a 10-year intervals for various birth cohorts, including 32yr olds, 39yr olds, 47yr olds, 56yr olds, and 65 yr olds (1960-1969, 1950-1959, 1940-1949, 1930-1939, 1920-1929 birth cohorts, respectively). For each birth cohort, uric acid levels increased during aging for men (left image below), whereas they increased for women starting at 40 years old:

Screen Shot 2020-01-06 at 7.18.04 AM

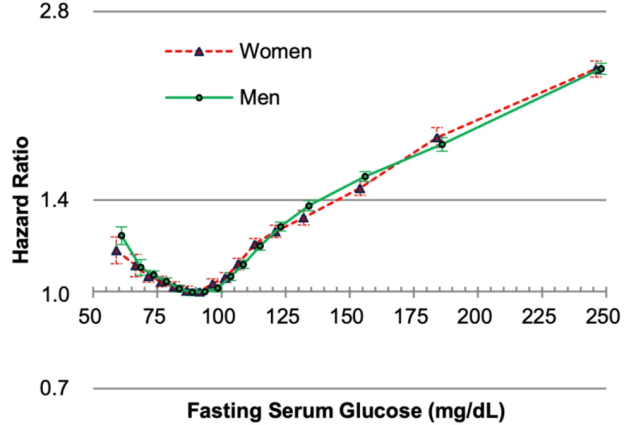
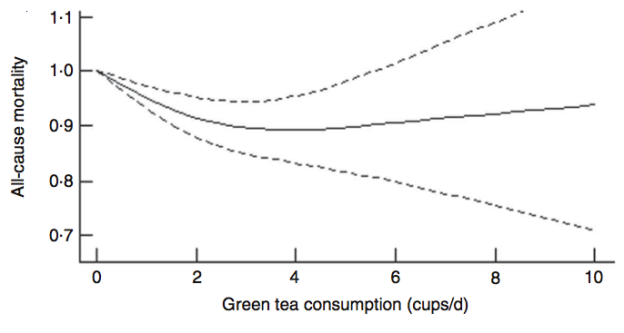
In terms of mortality risk, lowest risk of death for all causes was associated with uric acid levels of 5 – 7 mg/dL for men and 4 – 6 mg/dL for women in the 9,118 adults (average age, 43y) of Hu et al. (2019). Also note the U-shaped curve for both genders, whereas mortality risk increases at both low and high levels of uric acid:

Screen Shot 2020-01-05 at 2.55.00 PM.png

Similarly, the lowest risk of death for all causes was associated with uric acid levels of 7 mg/dL for men, and 4 mg/dL for women in the 375,163 adults (average age, 40y) of Cho et al. (2018), with mortality risk significantly increasing at uric levels < 3.5 and > 9.5 mg/dL for men, < 2.5 and > 7.5 mg/dL for women. Collectively, these 2 studies in middle-aged adults suggest that uric acid levels ~ 4 mg/dL for women and ~7 for men may be optimal for reducing risk of disease for all causes. It’s also important to note that both low and higher values are associated with an increased mortality risk.

The data for the Hu and Chu studies are in younger adults, so how does the data look in older adults? Lowest all-cause mortality risk was associated with uric acid levels between 4 – 5 mg/dL in the 121, 771 older adults (average age, 73y) of Tseng et al. (2018), with mortality risk significantly increasing below 4 and > 8:

Screen Shot 2020-01-05 at 2.43.46 PM.png

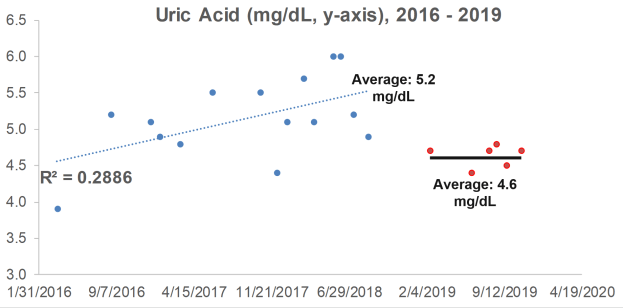
What are my uric acid levels? From 2016 to 2018, I measured it 15x, and although my average value of 5.2 mg/dL is not too low or too high in terms of an increased all-cause mortality risk, it increased during that 3-year period (R2 = 0.2886). When considering that uric acid increases during aging, can I reduce it with diet?

ua ml

Because I track my daily nutritional intake, I can look for correlations between my dietary intake with circulating biomarkers. Interestingly, a moderately strong correlation between my lycopene intake with uric acid (R2 = 0.3343, p=0.024) was present from 2016 to 2018:

ua vs lyco.png

Lycopene is found almost exclusively in tomatoes and watermelon. If these foods are related to my increasing levels of uric acid, if I ate less of them, I’d expect to see a corresponding decrease in uric acid. So, in 2019, I ate less of these foods, thereby reducing my average lycopene intake from 11,585 to 9,132 micrograms per day. How did that affect circulating levels of uric acid?

In 6 measurements for 2019, my average uric acid level was 4.6 mg/dL, a value that was significantly different (p=0.02) from the 2016-2018 average of 5.2 mg/dL. Whether eating less watermelon and tomatoes caused the decrease is unknown, but it’s good to know that uric acid can be potentially modified with dietary change!

my ua


If you’re interested, please have a look at my book!

References

Cho SK, Chang Y, Kim I, Ryu S. U-Shaped Association Between Serum Uric Acid Level and Risk of Mortality: A Cohort Study. Arthritis Rheumatol. 2018 Jul;70(7):1122-1132. doi: 10.1002/art.40472.

Hu L, Hu G, Xu BP, Zhu L, Zhou W, Wang T, Bao H, Cheng X. U-Shaped Association of Serum Uric Acid with All-cause and Cause-Specific Mortality in US Adults: A Cohort Study. J Clin Endocrinol Metab. 2019 Oct 25. pii: dgz068. doi: 10.1210/clinem/dgz068.

Kuzuya M, Ando F, Iguchi A, Shimokata H. Effect of aging on serum uric acid levelslongitudinal changes in a large Japanese population group. J Gerontol A Biol Sci Med Sci. 2002 Oct;57(10):M660-4.

Tseng WC, Chen YT, Ou SM, Shih CJ, Tarng DC; Taiwan Geriatric Kidney Disease (TGKD) Research Group. U-Shaped Association Between Serum Uric Acid Levels With Cardiovascular and All-Cause Mortality in the Elderly: The Role of Malnourishment. J Am Heart Assoc. 2018 Feb 10;7(4). pii: e007523. doi: 10.1161/JAHA.117.007523.

Life Expectancy Increase (12-14 Years) With 5 Factors

Following five lifestyle-related factors is associated with a gain in average life expectancy (Li et al. 2018). What are these factors? Not smoking, having a BMI between 18.5 to 24.9 kg/m2, engaging in more than 30 minutes of moderate to vigorous physical activity (at a minimum, walking ~3 miles per hour; 30 minutes of that = 1.5 miles of walking per day), moderate alcohol intake (5 to 15 g/d for women and 5 to 30 g/d for men), and a high diet quality score.

Starting at age 50y, having all 5 of these factors was associated with a life expectancy of an additional 43.1 years for women, and 37.6 years for men, which is an increase in average life expectancy of 14 years for women and 12 years for men, respectively:

Screen Shot 2019-09-29 at 12.49.55 PM.png

Quantifying whether or not you have the first 4 factors is easy, but what qualifies as having a high dietary score? The alternative healthy eating index (AHEI; McCullough et al. 2002) was used to define the dietary score. An AHEI score of more than 43.5 in women and 50 in men qualifies as having a high dietary quality. How is the AHEI defined?

If you eat more than 5 servings of vegetables (1 serving = ~3 ounces, or 80g) per day, you get 10 points. Similarly, more than 4 servings of fruit gets you 10 points. If you eat 1 serving (= 1.5 ounces, or 42 grams) of nuts and or soy protein (tofu) you get 10 points. If your intake of white meat (including fish, poultry) divided by red meat is greater than 4, you get 10 points. If you eat > 9 grams of cereal fiber (not 9 grams of grains, but the actual fiber content) per day, you get 10 points. For example, 9 grams of cereal fiber corresponds to 90g/day of dry oats. Alcohol is also included within the AHEI: if you have 1.5 – 2.5 servings of alcoholic drinks per day (for men) or 0.5 – 1.5 servings/day for women, that’s 10 points. Zero points would be not consuming alcoholic drinks, or > 3.5 drinks for men, and > 2.5 drinks per day for women. Having a polyunsaturated/saturated fat (P:S) intake > 0.5 yields 8 points, whereas a ratio > 0.7 yields 10 points. Consuming < 0.9 grams of trans fat per day yields 10 points, and finally, using a multivitamin for more than 5 years yields 10 points. To determine your score, have a a look at the median AHEI values reported for men:

Screen Shot 2019-09-29 at 10.11.15 AM

And for women:

Screen Shot 2019-09-29 at 10.13.37 AM.png

How many of the 5 factors do I have? I don’t smoke, my BMI is within the BMI range (my body weight was 158 this morning, so barely!), and I easily walk more than an hour/day + 3-4 days of exercise/week, so I qualify for the first 3 factors. However, I rarely drink alcohol, so I don’t qualify for that factor. What about the diet quality factor? To determine that, I’ll need to calculate if I have more than 50 AHEI points.

For the AHEI index, getting 5, 4, and 1 servings of veggies, fruit, and nuts per day is easy for me, so I’ve got 30 points so far. I eat oats once or twice/week, but not enough to get 9g of cereal fiber/day, so 0 points there. I eat 80 grams of sardines every day (560 grams/week), and ~150 grams of red meat per week, for a ratio of 3.7. That wouldn’t qualify me for 10 points, but 8 instead (see Quintile 4), where the white/red meat ratio would need to be higher than 2.5. I rarely drink alcohol, so 0 points for me there. Using last week’s dietary data, my P:S ratio is about 0.5, and my trans fat intake (almost exclusively from full-fat dairy) is 0.7 g/day, so I get 8 points and 10 points, respectively. In terms of multivitamin use, I only supplement with Vitamin D in the winter, and with a methylfolate-methylcobalamin-B6 stack (to reduce my homocysteine by ~10%). I haven’t been supplementing with that stack for more than five years, so I get a 0 there. Nonetheless, my score is 56 points, which would qualify me as having a high diet quality score.

Collectively, I have 4 of the 5 lifestyle factors that are associated with an increase in life expectancy. Based on the data from Li et al., my average life expectancy would be 85.4y. Adding in moderate alcohol intake would give me all 5 factors, and would result in a life expectancy gain of an additional 2.2 years. I’ve included 1-2 glasses of wine in my diet in the past, but it had no effect on my HDL or other circulating biomarkers, so I removed it. For me, the risk related to alcohol intake may not be worth the gain in life expectancy. Also note that these are average, population-based values, and I expect an additional gain in life expectancy gain because of my continuous quest for biological age optimization (https://michaellustgarten.wordpress.com/2019/09/09/quantifying-biological-age_!

References

Li Y, Pan A, Wang DD, Liu X, Dhana K, Franco OH, Kaptoge S, Di Angelantonio E, Stampfer M, Willett WC, Hu FB. Impact of Healthy Lifestyle Factors on Life Expectancies in the US Population. Circulation. 2018 Jul 24;138(4):345-355. doi: 10.1161/CIRCULATIONAHA.117.032047.

McCullough ML, Feskanich D, Stampfer MJ, Giovannucci EL, Rimm EB, Hu FB, Spiegelman D, Hunter DJ, Colditz GA, Willett WC. Diet quality and major chronic disease risk in men and womenmoving toward improved dietary guidanceAm J Clin Nutr. 2002 Dec;76(6):1261-71.

If you’re interested, please have a look at my book!

Drink Green Tea, Reduce All-Cause Mortality Risk?

Is green tea consumption associated with reduced risk of death risk from all causes? To investigate this question, Tang et al. (2015) performed a meta-analysis of 5 studies, including 200,884 subjects. As shown below, drinking 2-3 cups (16-24 oz.) of green tea per day was associated with maximally decreased all-cause mortality risk, ~10%.

green tea

Post update (9/15/2019): Is there new data since this post was first published (2015) for the association between green tea with all-cause mortality risk? Two relatively large studies have been published since then. First, in a study of 164,681 men (average age, ~53y), consuming green tea (~15g/day) was associated with a maximally reduced risk of death from all causes (black lines; Liu et al. 2016). However, note that this data included both smokers and non-smokers. For non-smokers (green lines), all-cause mortality risk was maximally reduced even further at smaller doses, including ~ 6-10g of green tea/day:

Screen Shot 2019-09-15 at 9.15.09 AM

In support of these data, never-smoking men and women (average age, ~52y) that drank more than  8.2g, and 3.3g, respectively, of green tea had an 11% reduced risk of all-cause mortality in Zhao et al. (2017).

The data is clear, drink green tea!

If you’re interested, please have a look at my book!

Reference

Liu J, Liu S, Zhou H, Hanson T, Yang L, Chen Z, Zhou M. Association of green tea consumption with mortality from all-cause, cardiovascular disease and cancer in a Chinese cohort of 165,000 adult men. Eur J Epidemiol. 2016 Sep;31(9):853-65.

Tang J, Zheng JS, Fang L, Jin Y, Cai W, Li D. Tea consumption and mortality of all cancers, CVD and all causes: a meta-analysis of eighteen prospective cohort studies. Br J Nutr. 2015 Jul 23:1-11.

Zhao LG, Li HL, Sun JW, Yang Y, Ma X, Shu XO, Zheng W, Xiang YB. Green tea consumption and cause-specific mortalityResults from two prospective cohort studies in ChinaJ Epidemiol. 2017 Jan;27(1):36-41.