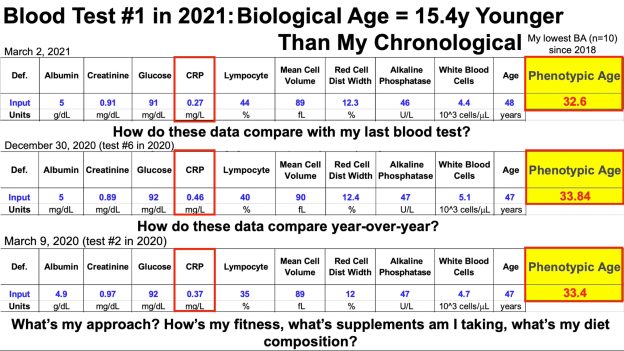
Results for my first blood test in 2021 are in-what’s my biological age, and how am I optimizing it?
If you’re interested in calculating your biological age, the spreadsheet is included as an Excel file in this link:
Results for my first blood test in 2021 are in-what’s my biological age, and how am I optimizing it?
If you’re interested in calculating your biological age, the spreadsheet is included as an Excel file in this link:
Discussed in the video:
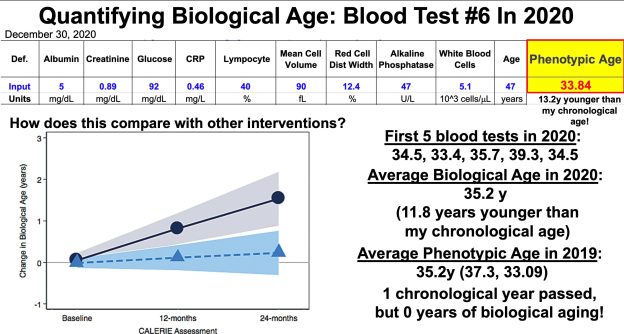
What’s my biological age on blood test #6 in 2020?
What’s my average biological age for 2020, and how does it compare with 2019?
Are there links between calorie intake, cardiovascular fitness (RHR, HRV), and diet composition with my biological age?

Here’s an interview that I did with Richard at Modern Healthspan, one of the best interviewers in aging!
Part I: Monitoring Biomarkers to Reverse Aging:
Part II, Diet, CR & Fasting:
Part III: Exercise, Protein
Part IV: Optimize Nutrients Through Diet
Part V: Inhibit CD38 to Optimize NAD
Part VI: Microbiome Impact on Muscle Metabolism
Part VII: Preferred Diet & Habit for Longevity

My latest blood test results are in-how’s my biological age?
In the video I discuss my dietary approach prior to my latest blood test, the blood test results, and my plan to improve them with diet going forward.
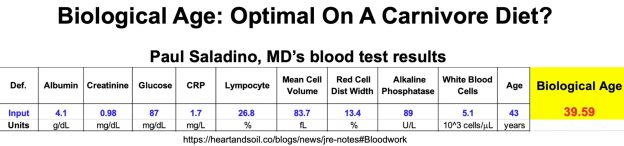
After going on Joe Rogan’s podcast, Paul Saladino, MD, posted his show notes, which included his blood test results. Based on that data, is his biological age optimal while on a carnivore diet?

My latest blood test results are in-how’s my biological age? In the video I discuss my dietary approach prior to my latest blood test, the blood test results, and my plan to improve them going forward.
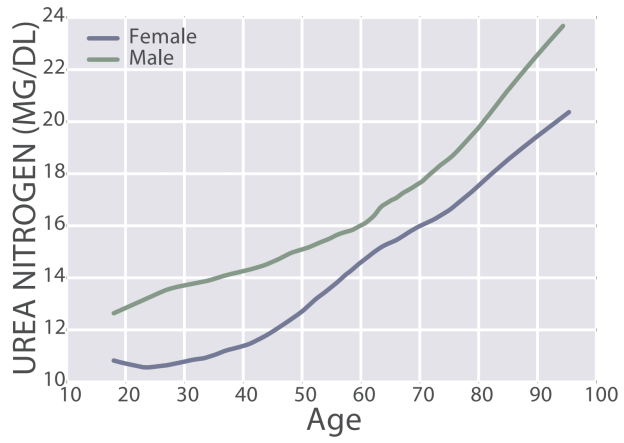
Blood urea nitrogen (BUN) is one of the 19 variables found on the biological age calculator, aging.ai. It measures the amount of nitrogen, as contained in urea (i.e., blood urea nitrogen, BUN) in your blood. The reference range for BUN is 5 – 20 mg/dL, but within that range, what’s optimal?
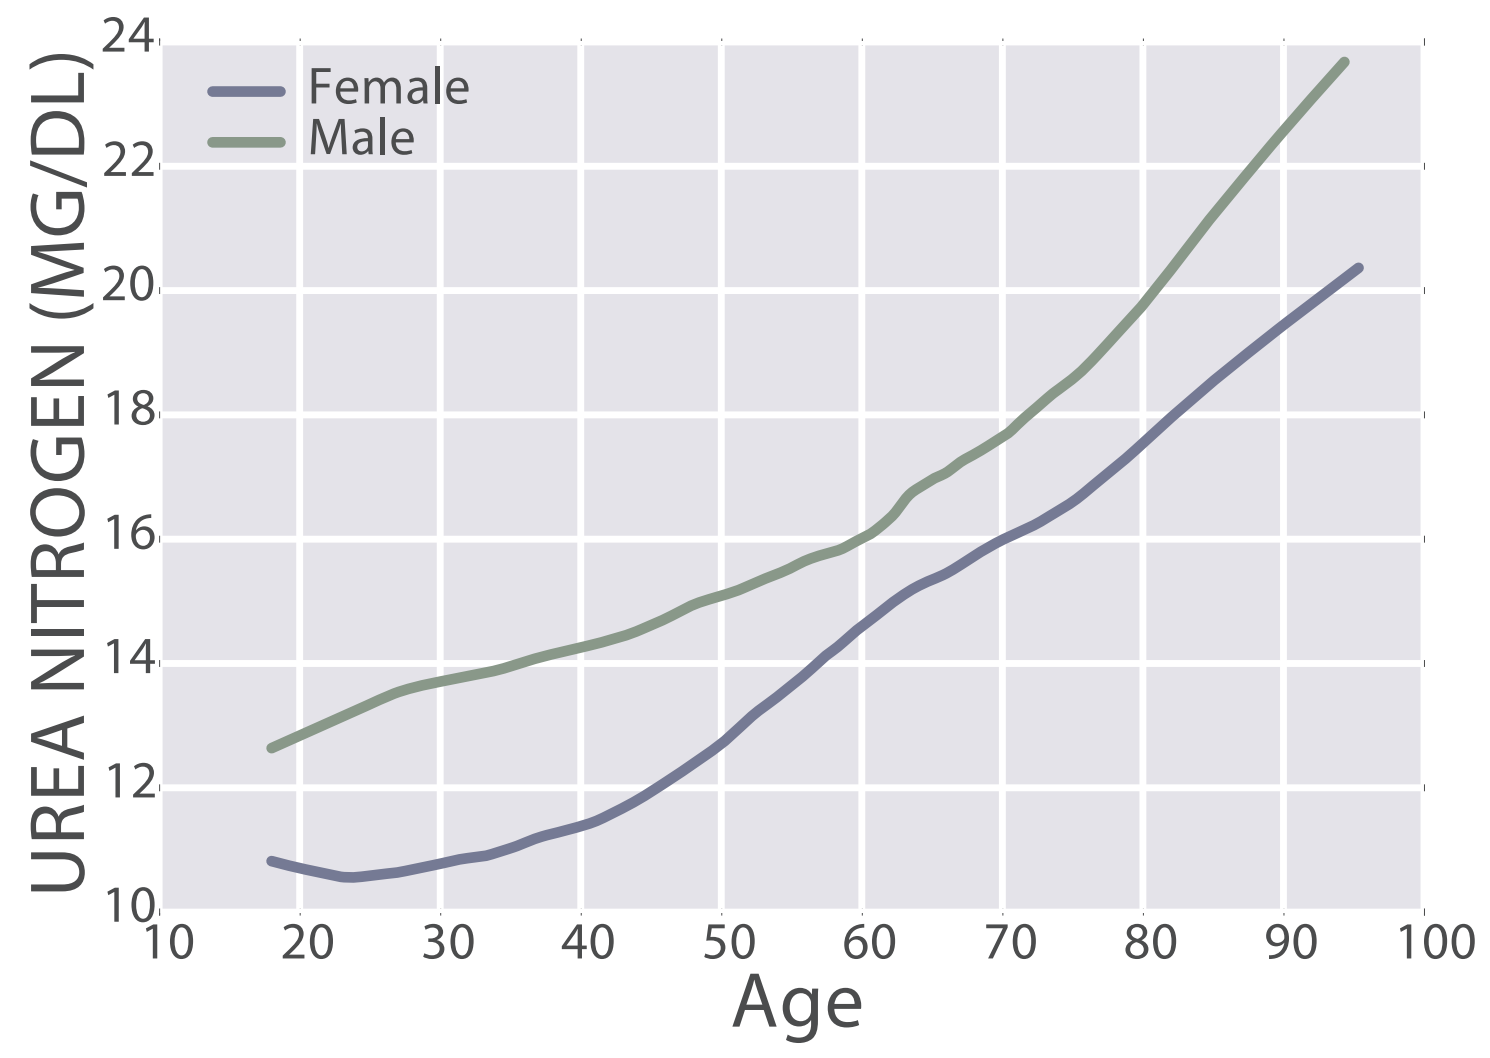
First, BUN increases during aging, from 11 – 13 mg/dL in 20 yr olds to 20 – 22 mg/dL in 90 yr olds (Wang et al. 2017):
The importance of the age-related increase in BUN is illustrated by the finding that risk of death for all causes increases above 15 mg/dL:

Also note that maximally decreased risk for all cause mortality was associated with BUN values between 5 – 15 mg/dL. In addition, even though a BUN value = 20 mg/dL is technically within the reference range, risk of death for all causes would be 50% higher when compared with someone that had BUN levels between 5 – 15 mg/dL. Collectively, based on the aging and all-cause mortality data, I’d argue that 5 – 13 mg/dL may be the optimal range for BUN.
Assuming normal kidney function (see https://michaellustgarten.wordpress.com/2019/11/18/optimizing-biologic-age-creatinine/), if your BUN is higher than 15 mg/dL, can it be reduced? Note that urea production is almost perfectly correlated (r = 0.98) with dietary protein intake (Young et al. 2000):
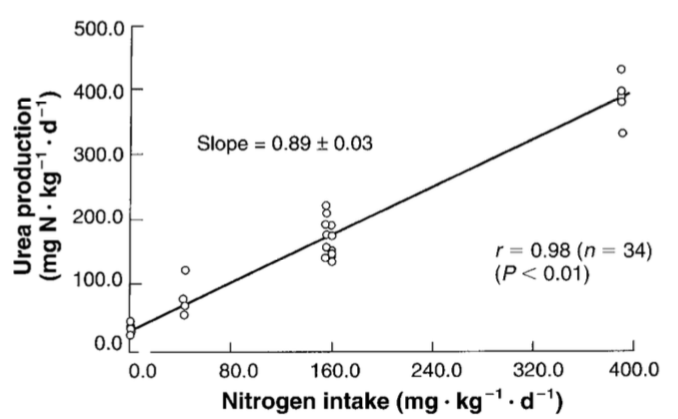
In other words, the main source of dietary nitrogen is protein, so if you eat a lot of protein, you’ll make a lot of urea. Circulating levels of urea can be easily calculated by measuring BUN, via: Urea [mg/dL]= BUN [mg/dL] * 2.14). Therefore, measuring BUN can then be used to determine if your protein intake is too high or too low.
What’s my BUN? As shown below, I’ve measured BUN 22 times since 2015. In line with the Young et al. (2000) data that showed an almost perfectly linear correlation between dietary nitrogen intake with urea production, similarly, as my dietary protein intake has increased, so have my BUN levels. The correlation between my dietary protein intake with BUN is strong (r = 0.76, R^2 = 0.575, p-value = 4.3E-05):
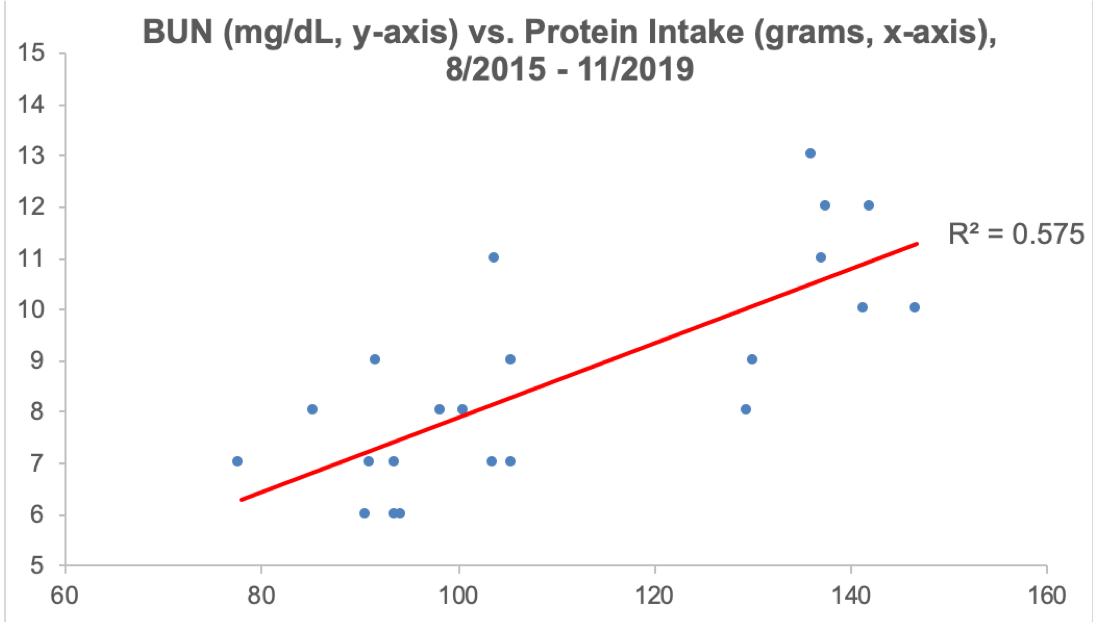
Note that my BUN is (purposefully) below 15 mg/dL, the upper limit for reduced all-cause mortality risk in Solinger and Rothman (2013), and within the 11 – 13 mg/dL range reported for the 20 yr olds of Wang et al. (2017).
For more recent tracked data, see the video!
References
Solinger AB, Rothman SI. Risks of mortality associated with common laboratory tests: a novel, simple and meaningful way to set decision limits from data available in the Electronic Medical Record. Clin Chem Lab Med. 2013 Sep;51(9):1803-13.
Wang Z, Li L, Glicksberg BS, Israel A, Dudley JT, Ma’ayan A. Predicting age by mining electronic medical records with deep learning characterizes differences between chronological and physiological age. J Biomed Inform. 2017 Dec;76:59-68. doi: 10.1016/j.jbi.2017.11.003.
Young VR, El-Khoury AE, Raguso CA, Forslund AH, Hambraeus L. Rates of urea production and hydrolysis and leucine oxidation change linearly over widely varying protein intakes in healthy adults. J Nutr. 2000 Apr;130(4):761-6.
If you’re interested, please have a look at my book!


Here’s a video clip about my latest Biological Age measurement!

Most often overlooked on a standard blood test are the mean corpuscular volume (MCW) and Red Blood Cell Distribution Width (RDW). How do they change during aging, and what’s associated with all-cause mortality risk? Also, with the goal of optimizing MCV and RDW, how does my diet correlate with these biomarkers?
