Category Archives: blood testing

Epigenetic Aging: Inflammation, Exercise, Smoking

Besides diet (https://michaellustgarten.wordpress.com/2019/12/07/slowing-epigenetic-aging-with-diet/), are there other factors that may impact epigenetic aging? First, let’s have a look at clinically relevant variables, including inflammation, the lipid profile, kidney function, blood pressure, and body size/dimensions (Liu et al. 2019):

EA crp.png

One of the strongest correlations for the clinical variables with epigenetic aging (AgeAccelGrim) is found for C-reactive protein (CRP), with higher CRP being associated with an older epigenetic age. This data supports the hypothesis that CRP levels as low as possible may be representative of biological youth, which I’ve previously written about (https://michaellustgarten.wordpress.com/2019/10/19/optimizing-biological-age-crp/). Similarly, higher values for insulin, glucose, triglycerides, systolic blood pressure, BMI, and the waist/hip ratio were correlated with an older epigenetic age, whereas higher HDL was correlated with a younger epigenetic age. Significant correlations were not identified for total or LDL cholesterol, creatinine, or diastolic blood pressure.

Investigating further, the strongest correlation for epigenetic aging was found for smoking, as current smokers had an older epigenetic age. In contrast, those who exercised, drank alcohol, and that had higher levels of education and income had younger epigenetic ages (Liu et al. 2019):

exerc ea


References

Lu AT, Quach A, Wilson JG, Reiner AP, Aviv A, Raj K, Hou L, Baccarelli AA, Li Y, Stewart JD, Whitsel EA, Assimes TL, Ferrucci L, Horvath S. DNA methylation GrimAge strongly predicts lifespan and healthspan. Aging (Albany NY). 2019 Jan 21;11(2):303-327. doi: 10.18632/aging.101684.

If you’re interested, please have a look at my book!

Epigenetic Aging: Can It Be Slowed With Diet?

Having a faster rate of epigenetic aging, as measured by the epigenetic age metric, AgeAccelGrim, is associated with a significantly increased risk of death for all causes in a variety of cohorts, including the Framingham Heart Study (FHS), the Women’s Health Initiative (WHI) study, the InChianti study, the Jackson Heart Study (JHS), and collectively, when evaluated as a meta-analysis (Lu et al. 2019):

Screen Shot 2019-12-07 at 2.23.27 PM.png

With the goal of minimizing disease risk and maximizing longevity, can epigenetic aging be slowed? Shown below is the correlation between dietary components with AgeAccelGrim. Dietary factors that were significantly associated  (the column labelled, “p”) with a younger epigenetic age were carbohydrate intake, dairy, whole grains, fruit, and vegetables. In contrast, dietary fat intake and red meat were associated with older epigenetic ages (Lu et al. 2019):

Screen Shot 2019-12-07 at 2.34.50 PM.png

Note that dietary recall data as a means for identifying nutrient intake can be unreliable-a better measure of dietary intake is circulating biomarkers. Are there associations between circulating biomarkers of nutrient intake with epigenetic aging?

Higher blood levels of carotenoids, including lycopene, alpha- and beta-carotene, lutein+zeaxanthin, and beta-cryptoxanthin were associated with a younger epigenetic age (Lu et al. 2019):

epi veg

If your goal is optimal health and longevity, eating foods that are rich in these nutrients may be an important strategy for slowing epigenetic aging. Which foods contain these nutrients? Carotenoids are found almost exclusively in vegetables and fruits. For example, lycopene is enriched in watermelon and tomatoes, alpha- and beta-carotene is high in carrots, orange vegetables (sweet potato, squash, pumpkin) and greens, lutein+zeaxanthin is prevalent in greens, and beta-cryptoxanthin’s highest levels are found in butternut squash and red bell peppers.

If you’re interested, please have a look at my book!

References

Nutrient composition data: https://reedir.arsnet.usda.gov/codesearchwebapp/(S(ujsr52ygvp0tw13m1luk0rny))/CodeSearch.aspx

Lu AT, Quach A, Wilson JG, Reiner AP, Aviv A, Raj K, Hou L, Baccarelli AA, Li Y, Stewart JD, Whitsel EA, Assimes TL, Ferrucci L, Horvath S. DNA methylation GrimAge strongly predicts lifespan and healthspan. Aging (Albany NY). 2019 Jan 21;11(2):303-327. doi: 10.18632/aging.101684.

Which Blood Test Analyte Is Most Important For Predicting Biologic Age?

Three studies have investigated the ability of blood test analytes to predict biological age. First, when considering the top 20 variables that were associated with biological age in aging.ai, albumin contributed most to this prediction, almost 2x more than circulating levels of glucose (Mamoshina et al. 2018):

Screen Shot 2019-12-01 at 1.04.59 PM.png

Second, albumin was one of the 9 blood test variables that were best able to predict biological age when using the Phenotypic Age calculator.  However, as shown below, it didn’t come in first place, but fifth. Interestingly, the analyte that contributed most to biological age prediction was the red cell distribution width (RDW%), with glucose again in second place (Levine et al. 2018):

Screen Shot 2019-12-01 at 1.21.58 PM

Third, Earls et al. (2019) used the Klemera-Doubal algorithm (Klemera and Doubal, 2006) in conjunction with blood test data to predict biological age. Regardless if the blood was analyzed by Labcorp or Quest, higher levels of albumin (the left side of both images below) were associated with the greatest reduction in biological age, up to 5 years! In contrast, HbA1c was associated with a higher biological age when measured by Labcorp (top image, right side), and second to lead in the Quest analysis (bottom image, right side). Interestingly, glucose came in third and fifth in the Labcorb and Quest data sets, respectively, in terms of its positive association with biological age.

Screen Shot 2019-12-01 at 12.59.22 PM

Glucose would’ve been an obvious choice, but would you have guessed that albumin may be just as important, and potentially more important for predicting biological age?


If you’re interested, please have a look at my book!

References

Earls JC, Rappaport N, Heath L, Wilmanski T, Magis AT, Schork NJ, Omenn GS, Lovejoy J, Hood L, Price ND. Multi-Omic Biological Age Estimation and Its Correlation With Wellness and Disease Phenotypes: A Longitudinal Study of 3,558 Individuals. J Gerontol A Biol Sci Med Sci. 2019 Nov 13;74(Supplement_1):S52-S60. doi: 10.1093/gerona/glz220.

Klemera P, Doubal S. A new approach to the concept and computation of biological age. Mech Ageing Dev. 2006;127:240–248. doi:10.1016/j. mad.2005.10.004

Levine ME, Lu AT, Quach A, Chen BH, Assimes TL, Bandinelli S, Hou L, Baccarelli AA, Stewart JD, Li Y, Whitsel EA, Wilson JG, Reiner AP, Aviv A, Lohman K, Liu Y, Ferrucci L, Horvath S. An epigenetic biomarker of aging for lifespan and healthspanAging (Albany NY). 2018 Apr 18;10(4):573-591. doi: 10.18632/aging.101414.

Mamoshina P, Kochetov K, Putin E, Cortese F, Aliper A, Lee WS, Ahn SM, Uhn L, Skjodt N, Kovalchuk O, Scheibye-Knudsen M, Zhavoronkov A. Population specific biomarkers of human aging: a big data study using South Korean, Canadian and Eastern European patient populations. J Gerontol A Biol Sci Med Sci. 2018 Jan 11.

Optimizing Biologic Age: Creatinine (and eGFR)

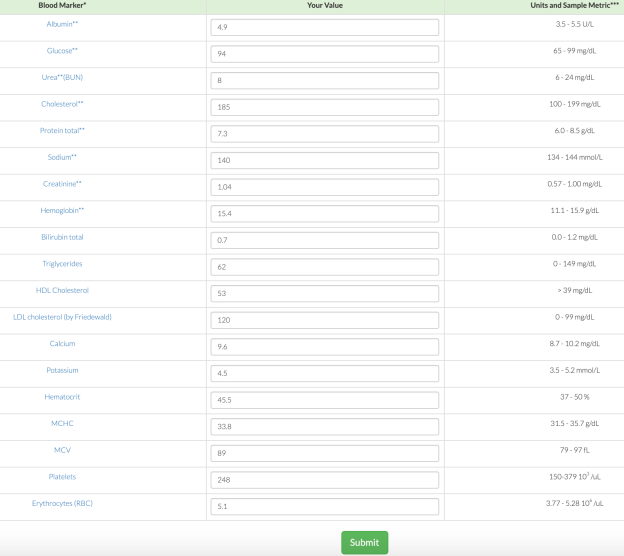
Creatinine is one of the 9 blood test variables included on the biological age calculator, Phenotypic Age (https://michaellustgarten.wordpress.com/2019/09/09/quantifying-biological-age/). The reference range for women and men is 0.5 – 1.1, and 0.6 – 1.2 mg/dL respectively, but within that range, what’s optimal for health and longevity?

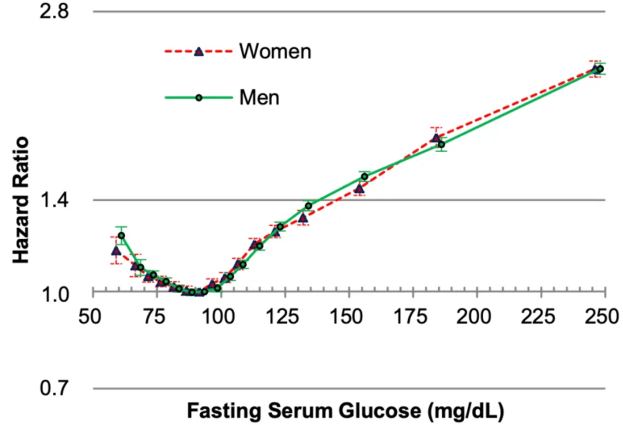
To answer that question, it’s important to know how circulating levels of creatinine change during aging, and its association with risk of death for all causes. Creatinine increases during aging, as reported in studies of 9,389 adults (age range, 30 – 75y; Levine 2013), and in 377,686 subjects (age range, 18 – 85y; Wang et al. 2017). However, the absolute values for these changes, i.e. from 0.8 to 1.0 mg/dL, for ex., was not reported in either study.

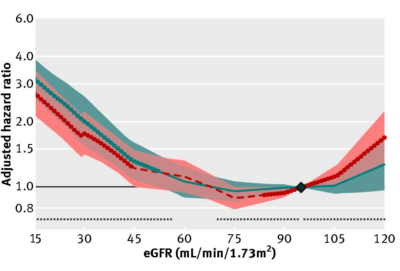
In terms of all-cause mortality risk, creatinine levels of 0.8 mg/dL (blue line; 95% confidence interval (CI), red dotted line) were associated with the lowest risk of death for all causes, with risk being significantly reduced for creatinine values between 0.6 – 1.1 mg/dL in the 30,760 older adults (median age, 69y) of Solinger and Rothman (2013):

Screen Shot 2019-11-04 at 6.14.02 AM.png

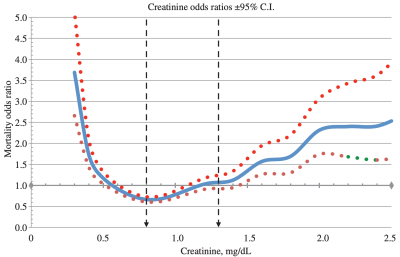
Note the U-shaped mortality curve for creatinine: all-cause mortality increased when it was both less than or greater than 0.8 mg/dL. More specifically, risk of death for all causes was significantly increased when serum levels of creatinine were less than ~0.55 and greater than 1.5 mg/dL.

Few studies have investigated the association between serum (or plasma) levels of creatinine with all-cause mortality risk, as most studies use creatinine in conjunction with chronological age, gender, and ethnicity to estimate kidney function (eGFR). For example, the MDRD equation (Levey et al. 2006) is commonly used to calculate eGFR, and if you’re interested in converting your creatinine levels into eGFR, here’s a link to calculate it (https://www.mdcalc.com/mdrd-gfr-equation). As creatinine goes up, eGFR goes down, and is indicative of worse kidney function. Based on that, we should expect to see an age-related decrease in kidney function, as measured by eGFR. Is this true?

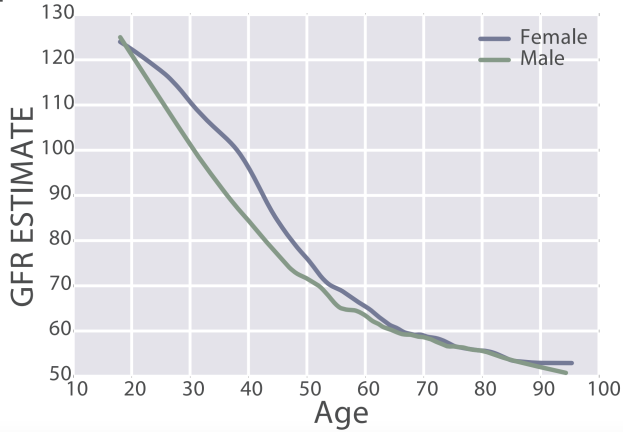
eGFR decreases during aging, from values ~125 in 20 year old women and men to ~50 mL/min/1.73m^2 in adults older than 90y in the 385,918 subjects (age range, 18 – 100y) of Wang et al. (2017):

Screen Shot 2019-11-18 at 7.28.27 AM

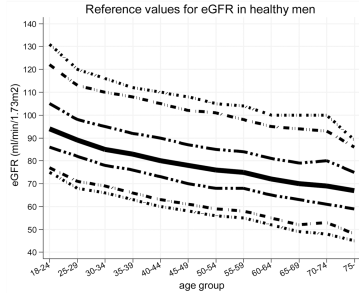
Similarly, eGFR decreased from ~90 (thick black line; 95% CI, dashed lines: 75 – 130 mL/min/1.73m^2) in young men (18-24y) to less than 70 (thick black line; 95% CI, dashed lines: 45 – 90 mL/min/1.73m^2) in men older than 75y (Baba et al. 2015):
Screen Shot 2019-08-17 at 1.54.30 PM.png

In women, eGFR decreased from values ~100 (thick black line; 95% CI, dashed lines: 70 – 135 mL/min/1.73m^2) in youth to ~70 (thick black line; 95% CI, dashed lines: 50 – 95 mL/min/1.73m^2) in women older than 75y (Baba et al. 2015):

Screen Shot 2019-08-17 at 1.59.26 PM.png

Similar findings have been reported for the age-related decline in eGFR in other studies, including Wetzels et al. (2007). When comparing young adults (18-24 year olds) with older adults (> 85y), median eGFR values declined from ~95 to ~65 mL/min/1.73m^2 in men, and from ~90 to ~60 mL/min/1.73m^2 in women.

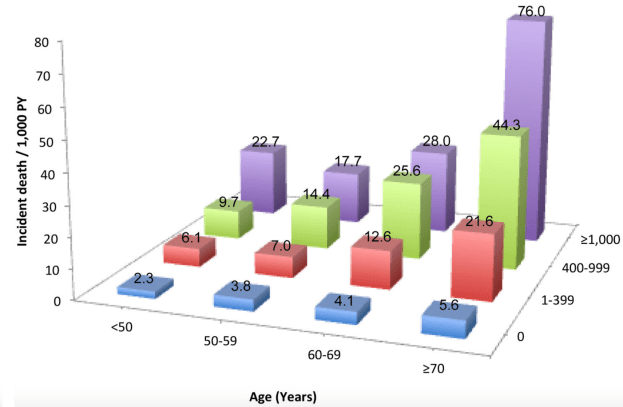
What’s the effect of reduced kidney function (i.e. increased creatinine, decreased eGFR) on risk of death for all causes? In a meta-analysis of 46 studies that included 2,051,158 subjects, risk of death for all causes was significantly increased when eGFR was less than 52 in women (red, below), and less than 44 in men (blue), when compared with eGFR values between 90 – 104 mL/min/1.73m^2 (95 was used as the reference; Nitsch et al. 2013):

egfr mort

In sum, creatinine increases during aging, which is associated with an increased all-cause mortality risk. Similarly, eGFR, which includes circulating values for creatinine, decreases during aging, and is also associated with an increased all-cause mortality risk. Therefore, if you’re tracking your creatinine levels with the goal of optimizing your biological age, it’s important to try to keep creatinine levels relatively low (i.e. around 0.8 mg/dL), and to avoid its age-related increase!


If you’re interested, please have a look at my book!


References

Baba M, Shimbo T, Horio M, Ando M, Yasuda Y, Komatsu Y, Masuda K, Matsuo S, Maruyama S. Longitudinal Study of the Decline in Renal Function in Healthy Subjects. PLoS One. 2015 Jun 10;10(6):e0129036.

Levey AS, Coresh J, Greene T, Stevens LA, Zhang YL, Hendriksen S, Kusek JW, Van Lente F; Chronic Kidney Disease Epidemiology Collaboration. Using standardized serum creatinine values in the modification of diet in renal disease study equation for estimating glomerular filtration rateAnn Intern Med. 2006 Aug 15;145(4):247-54.

Levine ME. Modeling the rate of senescence: can estimated biological age predict mortality more accurately than chronological age? J Gerontol A Biol Sci Med Sci. 2013 Jun;68(6):667-74. doi: 10.1093/gerona/gls233.

Nitsch D, Grams M, Sang Y, Black C, Cirillo M, Djurdjev O, Iseki K, Jassal SK, Kimm H, Kronenberg F, Oien CM, Levey AS, Levin A, Woodward M, Hemmelgarn BR; Chronic Kidney Disease Prognosis Consortium. Associations of estimated glomerular filtration rate and albuminuria with mortality and renal failure by sex: a meta-analysis. BMJ. 2013 Jan 29;346:f324. doi: 10.1136/bmj.f324.

Solinger AB, Rothman SI. Risks of mortality associated with common laboratory tests: a novel, simple and meaningful way to set decision limits from data available in the Electronic Medical Record. Clin Chem Lab Med. 2013 Sep;51(9):1803-13. doi: 10.1515/cclm-2013-0167.

Wang Z, Li L, Glicksberg BS, Israel A, Dudley JT, Ma’ayan A. Predicting age by mining electronic medical records with deep learning characterizes differences between chronological and physiological ageJ Biomed Inform. 2017 Dec;76:59-68. doi: 10.1016/j.jbi.2017.11.003.

Wetzels JF, Kiemeney LA, Swinkels DW, Willems HL, den Heijer M. Age– and gender-specific reference values of estimated GFR in Caucasians: the Nijmegen Biomedical StudyKidney Int. 2007 Sep;72(5):632-7.

Optimizing Biologic Age: Lymphocyte %

The percentage of lymphocytes is one of the 9 blood test variables included in the biological age calculator, Phenotypic Age (https://michaellustgarten.wordpress.com/2019/09/09/quantifying-biological-age/). The reference range for lymphocyte % is 20 – 40% of the total amount of white blood cells (WBCs), but are higher or lower values optimal for health and longevity?

To answer that question, it’s important to know how levels of lymphocytes change during aging, and its association with risk of death for all causes. In one of the earliest studies to examine how the percentage of lymphocytes changes with age, Levine (2013) reported that lymphocyte % significantly decreased during aging in 9,389 adults (age range, 30 – 75y). However, the absolute values for these changes, i.e. from 40% to 30%, for ex., was not reported.

Similarly, lymphocyte % decreased during aging in a much larger study (377,686 subjects; age range, 18 – 85y; Wang et al. 2017):

Screen Shot 2019-11-16 at 9.38.37 AM

Interestingly, for women, lymphocyte % decreased from 27% to 21% from 20 – 35y, increased from 21% to 26% from 35 – 55y, then again decreased from 26% to 20% from 55y to 85y. In contrast, lymphocyte % more steadily decreased for men, from 28% to 17% from 20 – 85y.

Based on the aging data, higher values for lymphocyte % are are associated with biologic youth, whereas lower values are found in older adults. Although there are few studies that have investigated associations between lymphocyte % with aging or disease risk, in contrast, more studies have been published for absolute levels of lymphocytes.

In a small study of 106 older adults (> 85y) that were healthy (i.e. free of disease) at baseline, lymphocytes  less than 1.14*10^9 cells/L (equivalent to 1140*10^6 cells/L) was associated with an increased risk of death for all causes, when compared with 1850*10^6 cells/L (Izaks et al. 2003):

lympho mort

In a larger study (624 subjects), lymphocytes less than 1540*10^6 cells/L was associated with a significantly shorter average lifespan (~5y; 0.5 proportion remaining below), when compared with 1540 – 2040*10^6 cells/L . Also note that survival for the group that had 1540 – 2040*10^9 lymphocytes/L was not significantly different from the group that had more than 2040*10^9 lymphocytes/L (Leng et al. 2005):Screen Shot 2019-11-16 at 8.36.34 AM.png

In agreement with the smaller studies, lymphocytes < 1300 and < 1200*10^6 cells/L in women and men (red and blue, far left), respectively was associated with an increased all-cause mortality risk, when compared with average lymphocyte values ~1900*10^6 cells/L (decile 5) in a larger study that included 262,394 non-smokers (age range, 37 – 73y; Welsh et al. 2018):

Screen Shot 2019-10-08 at 7.26.51 AM

Collectively, these data suggest that higher values for lymphocyte % and for the absolute amount of lymphocytes may be optimal for minimizing disease risk and for maximizing longevity. If both are low, can they be raised? Circulating levels of lymphocytes are reduced during zinc deficiency (Fraker and King, 2001), so monitoring zinc intake, then increasing it to at least the RDA may be a first step towards increasing lymphocyte levels and %.

If you’re interested, please have a look at my book!

References

Fraker PJ, King LE. A distinct role for apoptosis in the changes in lymphopoiesis and myelopoiesis created by deficiencies in zincFASEB J. 2001 Dec;15(14):2572-8.

Izaks GJ, Remarque EJ, Becker SV, Westendorp RG. Lymphocyte count and mortality risk in older persons. The Leiden 85-Plus Study. J Am Geriatr Soc. 2003 Oct;51(10):1461-5.

Leng SX, Xue QL, Huang Y, Ferrucci L, Fried LP, Walston JD. Baseline total and specific differential white blood cell counts and 5-year all-cause mortality in community-dwelling older womenExp Gerontol. 2005 Dec;40(12):982-7.

Levine ME. Modeling the rate of senescence: can estimated biological age predict mortality more accurately than chronological age? J Gerontol A Biol Sci Med Sci. 2013 Jun;68(6):667-74. doi: 10.1093/gerona/gls233.

Wang Z, Li L, Glicksberg BS, Israel A, Dudley JT, Ma’ayan A. Predicting age by mining electronic medical records with deep learning characterizes differences between chronological and physiological ageJ Biomed Inform. 2017 Dec;76:59-68. doi: 10.1016/j.jbi.2017.11.003.

Welsh C, Welsh P, Mark PB, Celis-Morales CA, Lewsey J, Gray SR, Lyall DM, Iliodromiti S, Gill JMR, Pell J, Jhund PS, Sattar N. Association of Total and Differential Leukocyte Counts With Cardiovascular Disease and Mortality in the UK Biobank. Arterioscler Thromb Vasc Biol. 2018 Jun;38(6):1415-1423. doi: 10.1161/ATVBAHA.118.310945.

1.7 Years of Biological Aging In The Past 3.6 Years

In an earlier post (https://michaellustgarten.wordpress.com/2018/06/26/maximizing-health-and-lifespan-is-calorie-restriction-essential/), I documented my aging.ai biologic age for 13 blood test measurements from 2016 – 2019. If you missed that post, here are those data:
agingai2Note that note my average biologic age has slowly increased from 2016 to 2019, from 28y in 2016 (2 measurements), to 29.25y in 2017 (6 measurements), to 29.5y in 2018 (6 measurements), to 30y in my June 2019 measurement.

To gain more insight into my 2019 prediction for biologic age, I kept measuring. On September 17, 2019, I had my worst biological age to date, 33y, based on the blood test data below:
Screen Shot 2019-11-03 at 3.51.05 PM.png

Seeing a biological age that high (for me) was the motivation that I needed to finally stick to a mild caloric restriction, which I hypothesized would positively affect my biological age. I wrote about this in my recent Phenotypic Age post (https://michaellustgarten.wordpress.com/2019/11/01/biological-age-31-3y-chronological-age-46y/). Did it work? Shown below is my blood test data for October 29th.

Screen Shot 2019-11-03 at 4.07.28 PM

Based on that data, my biological age was 28y, and when averaging the 3 measurements in 2019 (so far!), my average biological age is 29.67y. When considering that my average biological age in 2016 was 28y, it looks like I’ve only aged ~1.7 years in 3.58 years of elapsed time!


If you’re interested, please have a look at my book!

Biological Age = 31.3y, Chronological Age= 46y

On June 10, 2019 (for the first time) I measured all of the blood test variables that are included in the biologic age calculator, Phenotypic Age, and ended up with a biological age = 35.39y (https://michaellustgarten.wordpress.com/2019/09/09/quantifying-biological-age/).

While that value is 23% younger than my chronological age (46y), I knew that I could do better! So I tried again on September 17, 2019. Basically, the same biological age, 35.58y:

pheno 8_2019.png

An 23% younger biological age on 2 separate dates, months apart might be good for most, but not for me. So, I tried again on October 29th, 2019, and voila, a biological age of 31.3y, which is 32% younger than my chronological age! How did I do it?

oct pheno.png

From my last blood test until my most recent blood test, I attempted a mild caloric restriction. To maintain my body weight, I require about 2800 calories per day, an amount which is based on daily body weight weighing in conjunction with daily dietary tracking. For the period of time that elapsed between my last 2 blood tests, I averaged 2657 calories/day, which is 3.2% less than the 2745 calories/day that I averaged for the dietary period that corresponded to my September blood test. That I was also in a very mild caloric restriction is confirmed by a reduction in my average body weight, which was (purposefully) down 0.7 lbs from September 17 to October 29th, when compared with the dietary period that corresponded to my September blood test (August 20 – September 17).

This is a superficial analysis of how I further reduced my biological age, but in future posts I’ll report the average dietary intake that corresponded to my relatively youthful biologic age!

If you’re interested, please have a look at my book!

Circulating Biomarkers Associated With Coronary Artery Calcification

The coronary artery calcification (CAC) score is a measure of how much calcification is in the coronary arteries, and accordingly, is an in vivo measure of atherosclerosis. Why is the CAC score important? Besides its role in atherosclerosis, risk of death for all causes goes up at any age as the CAC score increases. For ex., in people younger than 50 (left side below), as the CAC score increases from 0 to 1-399, 400-999, and > 1000, risk of death for all causes increases by ~10-fold, from 2.3 per 1000 person years (PY) to 6.1/1000, 9.7/1000, and 22.7/1000. Similarly, for people older than 70y (right side below), as the CAC score increases, baseline all-cause mortality risk increases ~15-fold, from 5.6/1000 to 21.6/1000, 44.3/1000, and 76/1000, respectively (Hartaigh et al. 2016):

Screen Shot 2019-10-20 at 8.40.05 AM.png

Are blood biomarkers associated with CAC? When the CAC score was elevated, a greater percentage of white blood cells (WBCs) that were neutrophils and the red blood cell distribution width (RDW%) were higher, whereas lower CAC scores were associated with higher levels for the fraction of lymphocytes divided by total WBCs and higher total red blood cells (den Harder et al. 2018):

n l rdw cac

In agreement with these data, CAC scores > 100 were associated with a higher RDW% (13.0%) and a higher neutrophil/lymphocyte ratio (NLR; 1.54), when compared with CAC < 100 (RDW = 12.8%; NLR = 1.39; Gürel et al. 2019).

The findings that a higher RDW% and higher levels of neutrophils, but lower levels of lymphocytes are associated with a higher CAC score is in agreement with the data for how these variables change with aging and their associations with all-cause mortality risk. First, note that I previously reported that RDW% increases during aging and is associated with an increased risk of death from all causes (https://michaellustgarten.wordpress.com/2019/09/25/optimizing-biological-age-rdw/). Similarly, neutrophils increase, whereas lymphocytes decrease, thereby leading to a higher neutrophil/lymphocyte ratio during aging, which is associated with an increased all-cause mortality risk (https://michaellustgarten.wordpress.com/2019/10/10/neutrophil-lymphocyte-ratio-and-survival/).

If you’re interested, please have a look at my book!

References

den Harder AM, de Jong PA, de Groot MCH, Wolterink JM, Budde RPJ, Iŝgum I, van Solinge WW, Ten Berg MJ, Lutgens E, Veldhuis WB, Haitjema S, Hoefer IE, Leiner T. Commonly available hematological biomarkers are associated with the extent of coronary calcifications. Atherosclerosis. 2018 Aug;275:166-173. doi: 10.1016/j.atherosclerosis.2018.06.017.

Gürel OM, Demircelik MB, Bilgic MA, Yilmaz H, Yilmaz OC, Cakmak M, Eryonucu B. Association between Red Blood Cell Distribution Width and Coronary Artery Calcification in Patients Undergoing 64-Multidetector Computed TomographyKorean Circ J. 2015 Sep;45(5):372-7. doi: 10.4070/kcj.2015.45.5.372.

Hartaigh BÓ, Valenti V, Cho I, Schulman-Marcus J, Gransar H, Knapper J, Kelkar AA, Xie JX, Chang HJ, Shaw LJ, Callister TQ, Min JK. 15-Year prognostic utility of coronary artery calcium scoring for all-cause mortality in the elderly. Atherosclerosis. 2016 Mar;246:361-6. doi: 10.1016/j.atherosclerosis.2016.01.039.

Sarcopenia, Disease Risk, And The Neutrophil/Lymphocyte Ratio

In an earlier post, based on data from the Baltimore Longitidunal Study on Aging (BLSA), I suggested that total white blood cell (WBCs) counts between 3500 to 6000 cells per microliter of blood may be optimal for reducing disease risk and for maximizing longevity (https://michaellustgarten.wordpress.com/2015/08/13/blood-testing-whats-optimal-for-wbc-levels/).

However, within WBCs, neutrophils increase, whereas lymphocytes decrease during aging (Ruggiero et al. 2007, Starr and Dreary 2011). As a result, the ratio between neutrophils with lymphocytes (NLR) increases during aging from ~1.5 in 20 year olds to ~1.8 in adults older than 75y (Li et al. 2015):

Screen Shot 2019-10-06 at 3.40.06 PM

An increased neutrophil/lymphocyte ratio during aging may be bad for health and disease risk. First, a higher neutrophil/lymphocyte ratio is associated with sarcopenia (defined as the age-related loss of muscle mass and physical function) in older adults (average age, 72y; Öztürk et al. 2018):

Screen Shot 2019-09-13 at 7.46.06 AM

Second, risk of death for all causes is significantly increased for older adults (average age, 66y) that had higher NLR values (60-80%, >80%, equivalent to NLR = 1.92-2.41, > 2.41), when compared with lower NLR values (< 20%, 20-40%, 40-60%, equivalent to NLR < 1.90; Fest et al. 2019):

nlr

Similarly, all-cause mortality risk was 30% increased in older adults (average age, 54y) that had NLR values > 1.77, when compared with < 1.77, and 40% increased for NLR values > 2.15, when compared with < 2.15 (Kime et al. 2018).

What are my NLR values? Over 17 blood test measurements from 2015 – 2019, my average NLR is 1.11. So far so good!

nlr


If you’re interested, please have a look at my book!


References

Fest J, Ruiter TR, Groot Koerkamp B, Rizopoulos D, Ikram MA, van Eijck CHJ, Stricker BH. The neutrophil-to-lymphocyte ratio is associated with mortality in the general population: The Rotterdam Study. Eur J Epidemiol. 2019 May;34(5):463-470.

Kim S, Eliot M, Koestler DC, Wu WC, Kelsey KT. Association of Neutrophil-to-Lymphocyte Ratio With Mortality and Cardiovascular Disease in the Jackson Heart Study and Modification by the Duffy Antigen Variant. JAMA Cardiol. 2018 Jun 1;3(6):455-462. doi: 10.1001/jamacardio.2018.1042.

Li J, Chen Q, Luo X, Hong J, Pan K, Lin X, Liu X, Zhou L, Wang H, Xu Y, Li H, Duan C. Neutrophil-to-Lymphocyte Ratio Positively Correlates to Age in Healthy PopulationJ Clin Lab Anal. 2015 Nov;29(6):437-43. doi: 10.1002/jcla.21791.

Öztürk ZA, Kul S, Türkbeyler İH, Sayıner ZA, Abiyev A. Is increased neutrophil lymphocyte ratio remarking the inflammation in sarcopenia? Exp Gerontol. 2018 Sep;110:223-229.

Ruggiero C, Metter EJ, Cherubini A, Maggio M, Sen R, Najjar SS, Windham GB, Ble A, Senin U, Ferrucci L. White blood cell count and mortality in the Baltimore Longitudinal Study of AgingJ Am Coll Cardiol. 2007 May 8;49(18):1841-50.

Starr JM, Deary IJ. Sex differences in blood cell counts in the Lothian Birth Cohort 1921 between 79 and 87 years. Maturitas. 2011 Aug;69(4):373-6.

Blood glucose: What’s optimal?

The reference range for circulating levels of glucose is 70-130 mg/dL. That’s a wide range, so what’s optimal, especially considering that glucose is one of the variables used to quantify of biological age (https://michaellustgarten.wordpress.com/2019/09/09/quantifying-biological-age)?

In the largest study published for this subject (12,455,361 adults), risk of death for all causes was maximally reduced for glucose levels between 80-94 mg/dL (Yi et al. 2017). In contrast, mortality risk significantly increased when glucose levels were < 80 or > 100 mg/dL in both men and women:
bg

As glucose levels rise above 100 mg/dL, risk for Type II diabetes increases, which is one potential explanation for higher glucose levels being associated with a higher mortality risk. Why would glucose levels lower than 80 mg/dL also be associated with worse health? Interestingly, glucose levels < 80 mg/dL are associated with an increased risk of death from “total external causes” (left panel below), including unintentional accidents and transport accidents (middle, right panel below) in a relatively large study of 345,318 adults (Yi et al. 2019). In addition, an increased mortality risk from transport accidents involving pedestrians or cyclists was associated with glucose levels below 55 mg/dL (data not shown):

Screen Shot 2019-10-02 at 6.33.07 AM

Glucose levels increase during aging (Yi et al. 2017), evidence that adds further merit that lower is better (but not below 80 mg/dL!):

Screen Shot 2019-10-02 at 6.47.39 AM.png

What are my glucose levels? Shown below is my data for the past 13 years:

my bg

On the left side of the chart, I measured my glucose levels about once per year from 33-40y, resulting in an average value of 89 mg/dL. Since 2015 I started daily dietary tracking, and tested more often (19x), resulting in an average value of 87 mg/dL. The comparison between these 2 groups of data is not significantly different (p=0.19). Based on the data in Yi et al., my glucose levels should have increased from 92 to 96 mg/dL during the past 13 years. Instead, my glucose levels during that period are relatively stable, with average value (87.5 mg/dL) that would be expected for a 26y old. So far, so good!

If you’re interested, please have a look at my book!


References

Yi SW, Park S, Lee YH, Park HJ, Balkau B, Yi JJ. Association between fasting glucose and all-cause mortality according to sex and age: a prospective cohort studySci Rep. 2017 Aug 15;7(1):8194. doi: 10.1038/s41598-017-08498-6.

Yi SW, Won YJ, Yi JJ. Low normal fasting glucose and risk of accidental death in Korean adults: A prospective cohort studyDiabetes Metab. 2019 Jan;45(1):60-66. doi: 10.1016/j.diabet.2018.01.005.