Tag Archives: Biological Age

Epigenetic Aging: Inflammation, Exercise, Smoking

Besides diet (https://michaellustgarten.wordpress.com/2019/12/07/slowing-epigenetic-aging-with-diet/), are there other factors that may impact epigenetic aging? First, let’s have a look at clinically relevant variables, including inflammation, the lipid profile, kidney function, blood pressure, and body size/dimensions (Liu et al. 2019):

EA crp.png

One of the strongest correlations for the clinical variables with epigenetic aging (AgeAccelGrim) is found for C-reactive protein (CRP), with higher CRP being associated with an older epigenetic age. This data supports the hypothesis that CRP levels as low as possible may be representative of biological youth, which I’ve previously written about (https://michaellustgarten.wordpress.com/2019/10/19/optimizing-biological-age-crp/). Similarly, higher values for insulin, glucose, triglycerides, systolic blood pressure, BMI, and the waist/hip ratio were correlated with an older epigenetic age, whereas higher HDL was correlated with a younger epigenetic age. Significant correlations were not identified for total or LDL cholesterol, creatinine, or diastolic blood pressure.

Investigating further, the strongest correlation for epigenetic aging was found for smoking, as current smokers had an older epigenetic age. In contrast, those who exercised, drank alcohol, and that had higher levels of education and income had younger epigenetic ages (Liu et al. 2019):

exerc ea


References

Lu AT, Quach A, Wilson JG, Reiner AP, Aviv A, Raj K, Hou L, Baccarelli AA, Li Y, Stewart JD, Whitsel EA, Assimes TL, Ferrucci L, Horvath S. DNA methylation GrimAge strongly predicts lifespan and healthspan. Aging (Albany NY). 2019 Jan 21;11(2):303-327. doi: 10.18632/aging.101684.

If you’re interested, please have a look at my book!

12-16 Years Younger Than My Chronological Age: What’s My Diet?

My average biological age in 2019 is 12 years younger than my chronological age (46y) based on the Phenotypic Age calculator (https://michaellustgarten.wordpress.com/2019/11/01/biological-age-31-3y-chronological-age-46y/), and 16y younger based on aging.ai (https://michaellustgarten.wordpress.com/2019/11/04/years-of-biological-aging-in-the-past-4-years/). One factor that likely contributes to my relatively youthful biological age is my diet.

Shown below is my average daily dietary intake from January 1 through November 7th, 2019 (n=306 days). I weigh all of my food with a food scale, so these aren’t estimated amounts:

Screen Shot 2019-11-10 at 10.15.49 AM.png

In terms of weight (or volume), green tea is atop the list, as I drink 20 oz/day. Carrots come in second place (for why, see https://michaellustgarten.wordpress.com/2018/07/06/serum-albumin-and-acm/), followed by strawberries, red bell peppers, bananas, watermelon (for the lycopene), cauliflower, blueberries, blackberries, and raspberries. Note that I mix the bananas and berries in my green smoothies, which I drink 3-4x/week, which includes spinach (#11) and parsley (#23).

What does my average daily macro- and micro-nutrient data look like for 2019?

Screen Shot 2019-11-10 at 10.33.03 AM

Note that I purposefully have higher than the RDA values for several nutrients, including Vitamin C (see https://michaellustgarten.wordpress.com/2019/09/19/vitamin-c-dietary-intake-and-plasma-values-whats-optimal-for-health/), Vitamin K (see https://michaellustgarten.wordpress.com/2015/05/08/eat-more-green-leafy-vegetables-reduce-mortality-risk/), selenium (see https://michaellustgarten.wordpress.com/2015/05/28/selenium-dietary-intake-and-plasma-values-whats-optimal-for-health/), and others (see michaellustgarten.com).

In terms of supplements, I use 1000 IU of vitamin D from November – May, and I take a methylfolate-methylB12-B6 supplement, to help keep my homocysteine levels low.

If you’re interested, please have a look at my book!

1.7 Years of Biological Aging In The Past 3.6 Years

In an earlier post (https://michaellustgarten.wordpress.com/2018/06/26/maximizing-health-and-lifespan-is-calorie-restriction-essential/), I documented my aging.ai biologic age for 13 blood test measurements from 2016 – 2019. If you missed that post, here are those data:
agingai2Note that note my average biologic age has slowly increased from 2016 to 2019, from 28y in 2016 (2 measurements), to 29.25y in 2017 (6 measurements), to 29.5y in 2018 (6 measurements), to 30y in my June 2019 measurement.

To gain more insight into my 2019 prediction for biologic age, I kept measuring. On September 17, 2019, I had my worst biological age to date, 33y, based on the blood test data below:
Screen Shot 2019-11-03 at 3.51.05 PM.png

Seeing a biological age that high (for me) was the motivation that I needed to finally stick to a mild caloric restriction, which I hypothesized would positively affect my biological age. I wrote about this in my recent Phenotypic Age post (https://michaellustgarten.wordpress.com/2019/11/01/biological-age-31-3y-chronological-age-46y/). Did it work? Shown below is my blood test data for October 29th.

Screen Shot 2019-11-03 at 4.07.28 PM

Based on that data, my biological age was 28y, and when averaging the 3 measurements in 2019 (so far!), my average biological age is 29.67y. When considering that my average biological age in 2016 was 28y, it looks like I’ve only aged ~1.7 years in 3.58 years of elapsed time!


If you’re interested, please have a look at my book!

Biological Age = 31.3y, Chronological Age= 46y

On June 10, 2019 (for the first time) I measured all of the blood test variables that are included in the biologic age calculator, Phenotypic Age, and ended up with a biological age = 35.39y (https://michaellustgarten.wordpress.com/2019/09/09/quantifying-biological-age/).

While that value is 23% younger than my chronological age (46y), I knew that I could do better! So I tried again on September 17, 2019. Basically, the same biological age, 35.58y:

pheno 8_2019.png

An 23% younger biological age on 2 separate dates, months apart might be good for most, but not for me. So, I tried again on October 29th, 2019, and voila, a biological age of 31.3y, which is 32% younger than my chronological age! How did I do it?

oct pheno.png

From my last blood test until my most recent blood test, I attempted a mild caloric restriction. To maintain my body weight, I require about 2800 calories per day, an amount which is based on daily body weight weighing in conjunction with daily dietary tracking. For the period of time that elapsed between my last 2 blood tests, I averaged 2657 calories/day, which is 3.2% less than the 2745 calories/day that I averaged for the dietary period that corresponded to my September blood test. That I was also in a very mild caloric restriction is confirmed by a reduction in my average body weight, which was (purposefully) down 0.7 lbs from September 17 to October 29th, when compared with the dietary period that corresponded to my September blood test (August 20 – September 17).

This is a superficial analysis of how I further reduced my biological age, but in future posts I’ll report the average dietary intake that corresponded to my relatively youthful biologic age!

If you’re interested, please have a look at my book!

Blood glucose: What’s optimal?

The reference range for circulating levels of glucose is 70-130 mg/dL. That’s a wide range, so what’s optimal, especially considering that glucose is one of the variables used to quantify of biological age (https://michaellustgarten.wordpress.com/2019/09/09/quantifying-biological-age)?

In the largest study published for this subject (12,455,361 adults), risk of death for all causes was maximally reduced for glucose levels between 80-94 mg/dL (Yi et al. 2017). In contrast, mortality risk significantly increased when glucose levels were < 80 or > 100 mg/dL in both men and women:
bg

As glucose levels rise above 100 mg/dL, risk for Type II diabetes increases, which is one potential explanation for higher glucose levels being associated with a higher mortality risk. Why would glucose levels lower than 80 mg/dL also be associated with worse health? Interestingly, glucose levels < 80 mg/dL are associated with an increased risk of death from “total external causes” (left panel below), including unintentional accidents and transport accidents (middle, right panel below) in a relatively large study of 345,318 adults (Yi et al. 2019). In addition, an increased mortality risk from transport accidents involving pedestrians or cyclists was associated with glucose levels below 55 mg/dL (data not shown):

Screen Shot 2019-10-02 at 6.33.07 AM

Glucose levels increase during aging (Yi et al. 2017), evidence that adds further merit that lower is better (but not below 80 mg/dL!):

Screen Shot 2019-10-02 at 6.47.39 AM.png

What are my glucose levels? Shown below is my data for the past 13 years:

my bg

On the left side of the chart, I measured my glucose levels about once per year from 33-40y, resulting in an average value of 89 mg/dL. Since 2015 I started daily dietary tracking, and tested more often (19x), resulting in an average value of 87 mg/dL. The comparison between these 2 groups of data is not significantly different (p=0.19). Based on the data in Yi et al., my glucose levels should have increased from 92 to 96 mg/dL during the past 13 years. Instead, my glucose levels during that period are relatively stable, with average value (87.5 mg/dL) that would be expected for a 26y old. So far, so good!

If you’re interested, please have a look at my book!


References

Yi SW, Park S, Lee YH, Park HJ, Balkau B, Yi JJ. Association between fasting glucose and all-cause mortality according to sex and age: a prospective cohort studySci Rep. 2017 Aug 15;7(1):8194. doi: 10.1038/s41598-017-08498-6.

Yi SW, Won YJ, Yi JJ. Low normal fasting glucose and risk of accidental death in Korean adults: A prospective cohort studyDiabetes Metab. 2019 Jan;45(1):60-66. doi: 10.1016/j.diabet.2018.01.005.

Optimizing Biological Age: RDW%

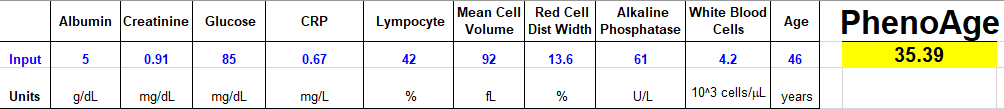
Can biological age be optimized? The red blood cell (RBC) distribution width (RDW%) is one of the variables included in the PhenoAge biological age calculator (see https://michaellustgarten.wordpress.com/2019/09/09/quantifying-biological-age/). Although the RDW% reference range is 11.5% – 14.5%, what values are optimal in terms a youthful biological age, and minimized disease risk?

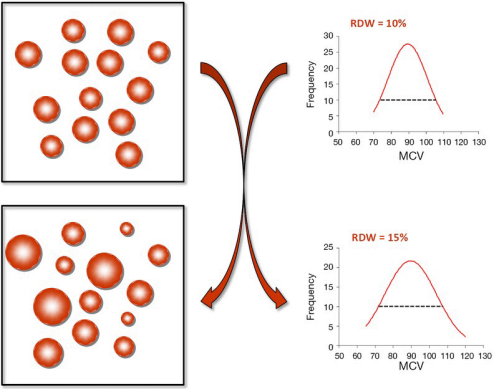
First, let’s define RDW%. RDW% is calculated by dividing the standard deviation of the average mean corpuscular volume (i.e. the average volume inside red blood cells, defined as MCV, upper right panel; image via Danese et al. 2015). When the volume inside red blood cells is approximately the same across all RBCs (upper left panel), the RDW% will be narrow, as shown by the dashed line in the upper right panel.  Conversely, during aging and in many diseases, the size and volume of RBCs are altered, resulting in a more broad RDW% (bottom left and right panels):

ani

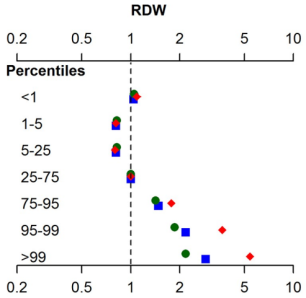
In terms of RDW%, what’s optimal for health and longevity? In the the largest study  (3,156,863 subjects) that investigated the association for risk of death for all causes with RDW%, maximally reduced risk of death was observed for RDW% between 11.4 – 12.5% (percentiles 1-5, 5-25), with mortality risk increasing for values < 11.3%, and > 12.6% (Tonelli et al. 2019):

rdw 2

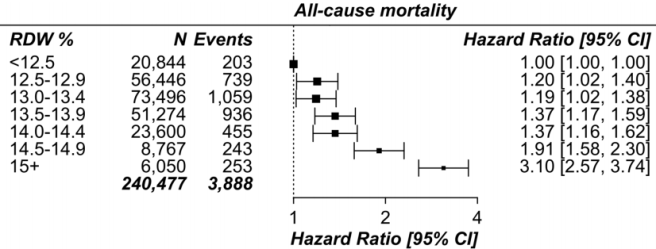
This has been confirmed in other relatively large studies (240,477 subjects), as RDW% values < 12.5% were associated with maximally reduced all-cause mortality risk, with values > 12.5 associated with an increasing all-cause mortality risk (Pilling et al. 2018):

rdw 3

How does RDW% change during aging? For the 1,907 subjects of Lippi et al. (2014), RDW% increased during aging:

rdw 4

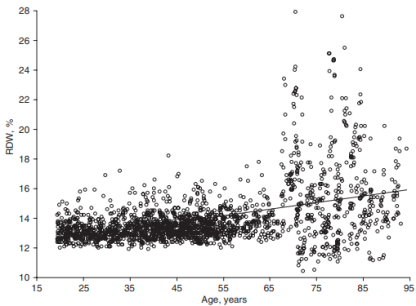
In support of this finding, RDW% also increased during aging in a larger study that included 8,089 subjects (Hoffmann et al. 2015).

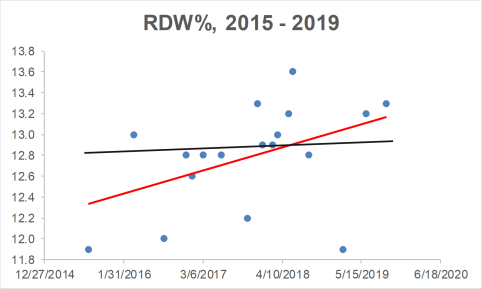
Collectively, when considering the all-cause mortality and aging data, RDW% values ~ 12.5% may be optimal for health and longevity. What are my RDW% values? Plotted below are 18 RDW% measurements since 2015 (blue circles). First, note my average RDW% during that time (black line) is 12.8%, which isn’t far from the 12.5% that may be optimal for health and longevity. However, note the trend line (red), which indicates that my RDW% values are increasing during aging!

rdw 5

How do I plan on reducing my RDW%? A moderate strength correlation exists between my calorie intake with RDW% (r = 0.53), with a higher daily average calorie intake being associated with a higher RDW%:
my rdw
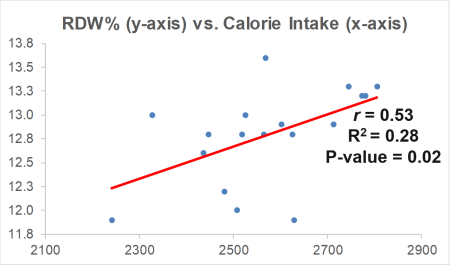
My plan is to shoot for a daily calorie intake ~2600 over the next month, and then retest my RDW% (and the rest of the CBC). Hopefully that brings my RDW% down to 12.5% or less. If that doesn’t work, I’ll re-calibrate, and try something else!

If you’re interested, please have a look at my book!

References

Danese E, Lippi G, Montagnana M. Red blood cell distribution width and cardiovascular diseasesJ Thorac Dis. 2015 Oct;7(10):E402-11. doi: 10.3978/j.issn.2072-1439.2015.10.04.

Hoffmann JJ, Nabbe KC, van den Broek NM. Red cell distribution width and mortality in older adults: a meta-analysis. Clin Chem Lab Med. 2015 Nov;53(12):2015-9. doi: 10.1515/cclm-2015-0155.

Lippi G, Salvagno GL, Guidi GC. Red blood cell distribution width is significantly associated with aging and gender. Clin Chem Lab Med. 2014 Sep;52(9):e197-9. doi: 10.1515/cclm-2014-0353.

Pilling LC, Atkins JL, Kuchel GA, Ferrucci L, Melzer D. Red cell distribution width and common disease onsets in 240,477 healthy volunteers followed for up to 9 years. PLoS One. 2018 Sep 13;13(9):e0203504. doi: 10.1371/journal.pone.0203504.

Tonelli M, Wiebe N, James MT, Naugler C, Manns BJ, Klarenbach SW, Hemmelgarn BR. Red cell distribution width associations with clinical outcomes: A population-based cohort studyPLoS One. 2019 Mar 13;14(3):e0212374. doi: 10.1371/journal.pone.0212374.
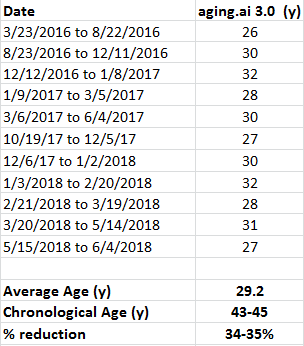
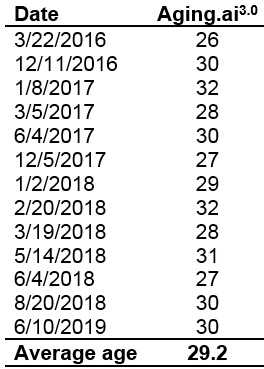
Quantifying Biological Age

In an earlier post, I wrote about quantifying my biological age with aging.ai (https://michaellustgarten.wordpress.com/2018/06/26/maximizing-health-and-lifespan-is-calorie-restriction-essential/). The importance of that post is illustrated by the finding that based on data from 13 blood tests between 2016 – 2019, my average biological age is 29.2y, which is ~33% younger than my chronological age.

On my quest for optimal health, I’m striving to get as accurate as possible when it comes to quantifying biological age. While the aging.ai biomarker set is strongly correlated with biologic age (r = 0.80), in 2018 two papers were published (Liu et al., Levine et al.) that introduced “Phenotypic Age”, which includes a combination of 9 circulating biomarkers + chronological age that is better at predicting biological age (r = 0.94) than aging.ai. It includes analytes that are found on the standard blood chemistry screen, including albumin, creatinine, glucose, lymphocyte %, mean corpuscular volume (MCV), red blood cell distribution width (RDW), alkaline phosphatase, white blood cells, and an analyte that is not found on that panel, C-reactive protein (CRP). In addition, chronological age is included as a covariate.

So what’s my biological age based on the Phenotypic Age calculator? When I input my data from my latest blood test measurement on 6/4/2019, I get a biological age of 35.39y, which is 23% lower than my chronological age of 46. Not bad!

phenoage

To quantify your biological age with the Phenotypic Age calculator, input your data in the Excel file that is embedded within the first paragraph of the following link:

DNAmPhenoAge_gen

3.27.25 Edit: In the link above, note that the denominator in D17 should be 0.090165, not 0.09165. Additionally, the units for albumin should be g/dL (not mg/dL), and lymphocyte isn’t spelled correctly. I can’t upload a new link-I’d have to upgrade my WordPress account to be able to upload files (which is ridiculous!).

If you’re interested, please have a look at my book!

References

Liu Z, Kuo PL, Horvath S, Crimmins E, Ferrucci L, Levine M. A new aging measure captures morbidity and mortality riskacross diverse subpopulations from NHANES IV: A cohort studyPLoS Med. 2018 Dec 31;15(12):e1002718. doi: 10.1371/journal.pmed.1002718.

Levine ME, Lu AT, Quach A, Chen BH, Assimes TL, Bandinelli S, Hou L, Baccarelli AA, Stewart JD, Li Y, Whitsel EA, Wilson JG, Reiner AP, Aviv A, Lohman K, Liu Y, Ferrucci L, Horvath S. An epigenetic biomarker of aging for lifespan and healthspanAging (Albany NY). 2018 Apr 18;10(4):573-591. doi: 10.18632/aging.101414.

Optimizing Biological Age: Is Calorie Restriction Essential?

My goal is to break the world record for lifespan, 122 years, which is currently held by Jean Calment. How do I plan to do that? A good start would be calorie restriction (CR), a diet where you eat 10-30%+ less calories than your normal intake. CR is the gold standard for increasing lifespan in a variety of organisms, including yeast, flies, worms, and rodents (McDonald et al. 2010).

With the goal of maximizing my health and lifespan, in April 2015, I started a CR diet. Inherent in that was weighing all my food and recording it on an online website that tracks macro-and micro-nutrients. From then until March 2016, I was pretty good at keeping my calories relatively low, as I averaged 2302 calories. However, since 3/2016, it’s been exceedingly difficult to keep my calories that low, as I’ve averaged 2557 calories/day. So is having a higher calorie intake worse for my lifespan goal than a lower calorie intake?

Maybe not. In addition to tracking my daily nutrition since 2015, I’ve also had regular blood testing performed. I’ve measured the typical things that you get at a yearly checkup, including the lipid profile (triglycerides, total cholesterol, LDL, HDL, VLDL) markers of kidney and liver  function (BUN, creatinine, uric acid, and ALT, AST, respectively), and the complete blood count (red and white blood cells, and their differentials). By tracking my daily nutrition and circulating biomarkers, I’m able to quickly intervene on any potential aging and disease-related mechanisms by using my diet to optimize my circulating biomarkers.

On my quest for optimal health and lifespan, biological age is more important than my chronological age (I’m 46y). So what’s my biological age? Between 2016-2019, the group at Insilico Medicine published 2 papers that included circulating biomarker data from more than 200,000 people (Putin et al. 2015, Mamoshina et al. 2018) to derive a biological age predictor (aging.ai). So what’s my biological age?

Shown below is my predicted biological age over 13 blood tests from 3/2016 to 6/2019:

agingai2

Although I wasn’t on a CR diet during that time, my average biological age was 29.2 years, which is ~34% younger than my chronological age. Would my biological age be even younger with a lower calorie intake? I’m working on reducing my calorie intake again (it’s not easy for me), so stay tuned for that!

Here are the my biomarker values corresponding to each blood test, for anyone who wants to double check the results:
agingai2 values

References

Mamoshina P, Kochetov K, Putin E, Cortese F, Aliper A, Lee WS, Ahn SM, Uhn L, Skjodt N, Kovalchuk O, Scheibye-Knudsen M, Zhavoronkov A. Population specific biomarkers of human aging: a big data study using South Korean, Canadian and Eastern European patient populations. J Gerontol A Biol Sci Med Sci. 2018 Jan 11.

McDonald RB, Ramsey JJ. Honoring Clive McCay and 75 years of calorie restriction research. J Nutr. 2010 Jul;140(7):1205-10.

Putin E, Mamoshina P, Aliper A, Korzinkin M, Moskalev A, Kolosov A, Ostrovskiy A, Cantor C, Vijg J, Zhavoronkov A. Deep biomarkers of human aging: Application of deep neural networks to biomarker development. Aging (Albany NY). 2016 May;8(5):1021-33.

If you’re interested, please have a look at my book: