In order to slow aging, it’s important to know how circulating biomarkers change during aging, and how these biomarkers are associated with risk of death for all causes. In this video, I discuss blood test data for the oldest old, including centenarians (100 – 104y), semi-centenarians (105 – 109y), and super-centenarians (110y+).
LPS increases during aging, which may explain the age-related increase for CD38 and decreased NAD+. LPS is decreased on a calorie restricted diet, but what else can reduce it? In this video, I present evidence for intestinal alkaline phosphatase’s (IAP) role on LPS, and posit that interventions that increase IAP may be an important approach for increasing NAD+.
My latest blood test results are in-how’s my biological age? In the video I discuss my dietary approach prior to my latest blood test, the blood test results, and my plan to improve them going forward.
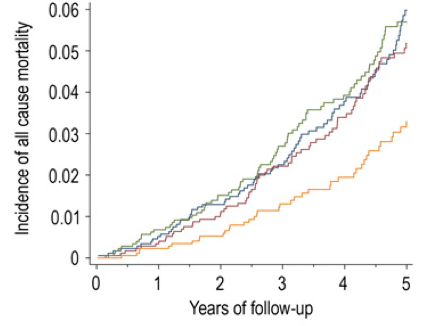
Vitamin K is found in 2 predominant forms, Vitamin K1 (phylloquinone), found almost exclusively in green leafy vegetables, and Vitamin K2 (Menaquinone), found in fermented foods, organ meats, meat, butter and eggs. In the data below (Juanola-Falgarona et al. 2014), we see that Vitamin K1 (phylloquinone) is negatively associated with death from all causes:
Death from all causes was assessed based on the average value for four groups of Vitamin K1 intake: 171 ug/day = blue line, 276 ug/day =red line, 349 ug/day = green line and 626 ug/day = the yellow line. In the data above, Vitamin K1 values less than 349 ug/day are about the same in terms of all-cause mortality risk. However, those who ate 626 ug/day of Vitamin K1 had about half of the mortality risk compared to the lower K1 intake groups! Interestingly, the RDA for Vitamin K, at 90 ug/day seems to be outdated, based on the data above. Also, Vitamin K2 was not associated with all-cause mortality risk, as shown below:
Based on the K1 mortality data, 626 ug/day seems like a good goal. However, osteocalcin is a Vitamin K-dependent protein that has been shown to be maximally active in the presence of 1000 ug of Vitamin K1 (Binkley et al. 2002)! Osteocalcin is involved in pathways that decline with aging: insulin secretion and β-cell proliferation in the pancreas, energy expenditure by muscle, insulin sensitivity in adipose tissue, muscle and liver, and increased testosterone production (Karsenty and Ferron 2012). Therefore, getting 1000 ug+ per day of Vitamin K1 may optimize all of these functions and, decrease mortality risk!
What’s the take home from these data? Eat more leafy greens! How much is needed to get 1000 ug per day? Shown below is a short list of foods rich in Vitamin K and the serving size needed to reach 1000 ug. Approximately 4 ounces of cooked kale or 7 oz. of raw spinach will suffice, and at a low calorie yield. Other foods, like broccoli, brussel sprouts or romaine lettuce would need to be consumed in far greater amounts to reach 1000 ug.
What’s my daily K1 intake? Shown below is my 7-day average (7/16/2015 – 7/22/2015) for K intake, derived almost exclusively from plant sources. 1379 ug/day puts me well above the 626 ug/day that was associated with reduced mortality risk, and above the 1000 ug/day needed for maximal osteocalcin activation.
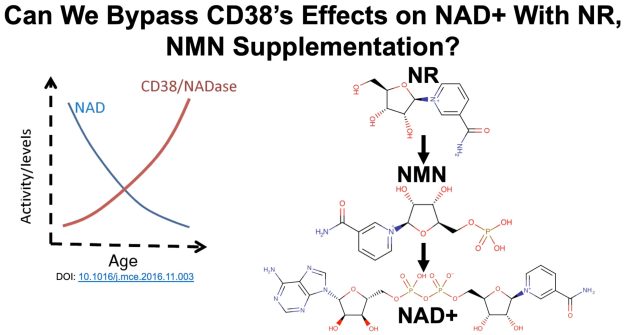
NR and NMN are popular ways to try to boost levels of NAD+, but that approach hasn’t worked every time in human studies. One reason for that may involve CD38, which degrades both NR and NMN. With the goal of boosting NAD+ levels during aging, why does CD38 increase with age, and what can be done about it? All that and more in this video!
Blood urea nitrogen (BUN) is one of the 19 variables found on the biological age calculator, aging.ai. It measures the amount of nitrogen, as contained in urea (i.e., blood urea nitrogen, BUN) in your blood. The reference range for BUN is 5 – 20 mg/dL, but within that range, what’s optimal?
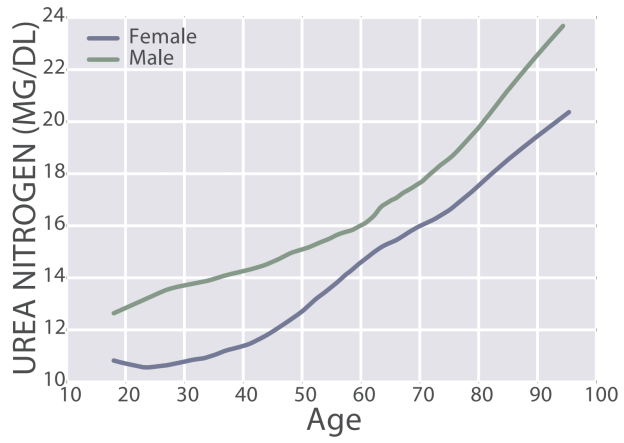
First, BUN increases during aging, from 11 – 13 mg/dL in 20 yr olds to 20 – 22 mg/dL in 90 yr olds (Wang et al. 2017):
The importance of the age-related increase in BUN is illustrated by the finding that risk of death for all causes increases above 15 mg/dL:
Also note that maximally decreased risk for all cause mortality was associated with BUN values between 5 – 15 mg/dL. In addition, even though a BUN value = 20 mg/dL is technically within the reference range, risk of death for all causes would be 50% higher when compared with someone that had BUN levels between 5 – 15 mg/dL. Collectively, based on the aging and all-cause mortality data, I’d argue that 5 – 13 mg/dL may be the optimal range for BUN.
In other words, the main source of dietary nitrogen is protein, so if you eat a lot of protein, you’ll make a lot of urea. Circulating levels of urea can be easily calculated by measuring BUN, via: Urea [mg/dL]= BUN [mg/dL] * 2.14). Therefore, measuring BUN can then be used to determine if your protein intake is too high or too low.
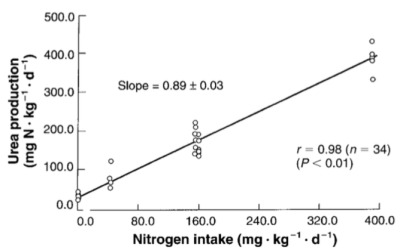
What’s my BUN? As shown below, I’ve measured BUN 22 times since 2015. In line with the Young et al. (2000) data that showed an almost perfectly linear correlation between dietary nitrogen intake with urea production, similarly, as my dietary protein intake has increased, so have my BUN levels. The correlation between my dietary protein intake with BUN is strong (r = 0.76, R^2 = 0.575, p-value = 4.3E-05):
Note that my BUN is (purposefully) below 15 mg/dL, the upper limit for reduced all-cause mortality risk in Solinger and Rothman (2013), and within the 11 – 13 mg/dL range reported for the 20 yr olds of Wang et al. (2017).
For more recent tracked data, see the video!
References
Solinger AB, Rothman SI. Risks of mortality associated with common laboratory tests: a novel, simple and meaningful way to set decision limits from data available in the Electronic Medical Record. Clin Chem Lab Med. 2013 Sep;51(9):1803-13.
Wang Z, Li L, Glicksberg BS, Israel A, Dudley JT, Ma’ayan A. Predictingage by miningelectronicmedicalrecords with deeplearningcharacterizesdifferences between chronological and physiologicalage. J Biomed Inform. 2017 Dec;76:59-68. doi: 10.1016/j.jbi.2017.11.003.
Young VR, El-Khoury AE, Raguso CA, Forslund AH, Hambraeus L. Rates of urea production and hydrolysis and leucine oxidation change linearly over widely varying protein intakes in healthy adults. J Nutr. 2000 Apr;130(4):761-6.
If you’re interested, please have a look at my book!
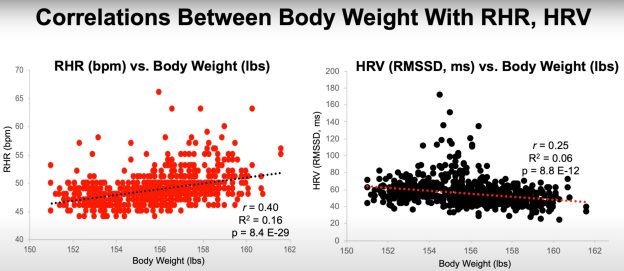
Consistent exercise training would seem like the obvious choice to reduce resting heart rate (RHR) and to increase heart rate variability (HRV). Are there other factors that can impact these variables? Body weight and daily calorie intake may affect RHR and HRV, and in the video I present 700+ days of data for these correlations.
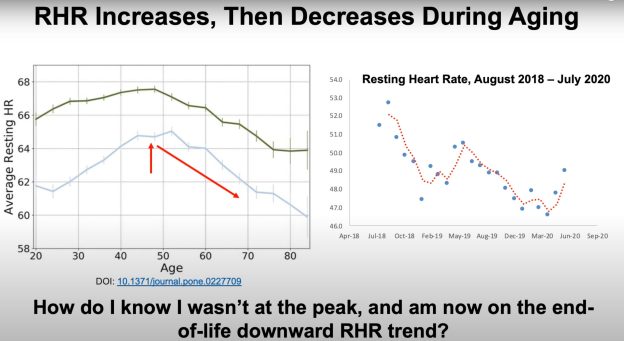
To determine what’s optimal for resting heart rate and heart rate variability, I review the published literature for how they change during aging, and what’s associated with mortality risk. Also included are my data over the past ~2 years, to see how I compare against the literature.
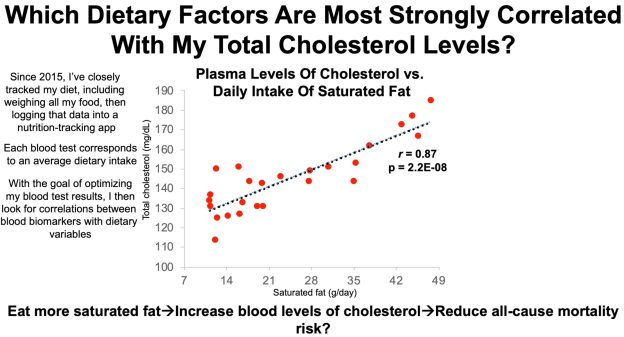
In an earlier video, I presented data for total cholesterol (TC) levels in blood in terms of changes during aging and all-cause mortality risk. I’ve measured TC 25 times in the past 5 years, and in this video, I present that data, and my approach to optimize it.