Tag Archives: aging

Ending Aging-Related Diseases 2019: Lustgarten Presentation

In the first half of this presentation, I talk about my contribution to the gut-muscle axis in older adults, and in the second half, my personalized approach to optimal health!

Also, here’s the article that corresponds to the presentation:
https://www.leafscience.org/the-gut-microbiome-affects-muscle-strength-in-older-adults/

If you’re interested, please have a look at my book!

Life Expectancy Increase (12-14 Years) With 5 Factors

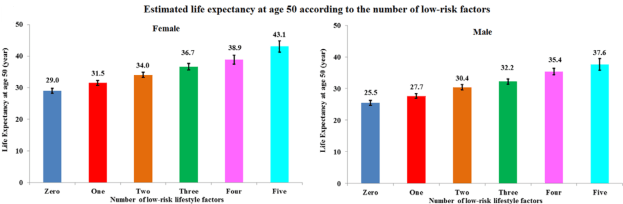
Following five lifestyle-related factors is associated with a gain in average life expectancy (Li et al. 2018). What are these factors? Not smoking, having a BMI between 18.5 to 24.9 kg/m2, engaging in more than 30 minutes of moderate to vigorous physical activity (at a minimum, walking ~3 miles per hour; 30 minutes of that = 1.5 miles of walking per day), moderate alcohol intake (5 to 15 g/d for women and 5 to 30 g/d for men), and a high diet quality score.

Starting at age 50y, having all 5 of these factors was associated with a life expectancy of an additional 43.1 years for women, and 37.6 years for men, which is an increase in average life expectancy of 14 years for women and 12 years for men, respectively:

Screen Shot 2019-09-29 at 12.49.55 PM.png

Quantifying whether or not you have the first 4 factors is easy, but what qualifies as having a high dietary score? The alternative healthy eating index (AHEI; McCullough et al. 2002) was used to define the dietary score. An AHEI score of more than 43.5 in women and 50 in men qualifies as having a high dietary quality. How is the AHEI defined?

If you eat more than 5 servings of vegetables (1 serving = ~3 ounces, or 80g) per day, you get 10 points. Similarly, more than 4 servings of fruit gets you 10 points. If you eat 1 serving (= 1.5 ounces, or 42 grams) of nuts and or soy protein (tofu) you get 10 points. If your intake of white meat (including fish, poultry) divided by red meat is greater than 4, you get 10 points. If you eat > 9 grams of cereal fiber (not 9 grams of grains, but the actual fiber content) per day, you get 10 points. For example, 9 grams of cereal fiber corresponds to 90g/day of dry oats. Alcohol is also included within the AHEI: if you have 1.5 – 2.5 servings of alcoholic drinks per day (for men) or 0.5 – 1.5 servings/day for women, that’s 10 points. Zero points would be not consuming alcoholic drinks, or > 3.5 drinks for men, and > 2.5 drinks per day for women. Having a polyunsaturated/saturated fat (P:S) intake > 0.5 yields 8 points, whereas a ratio > 0.7 yields 10 points. Consuming < 0.9 grams of trans fat per day yields 10 points, and finally, using a multivitamin for more than 5 years yields 10 points. To determine your score, have a a look at the median AHEI values reported for men:

Screen Shot 2019-09-29 at 10.11.15 AM

And for women:

Screen Shot 2019-09-29 at 10.13.37 AM.png

How many of the 5 factors do I have? I don’t smoke, my BMI is within the BMI range (my body weight was 158 this morning, so barely!), and I easily walk more than an hour/day + 3-4 days of exercise/week, so I qualify for the first 3 factors. However, I rarely drink alcohol, so I don’t qualify for that factor. What about the diet quality factor? To determine that, I’ll need to calculate if I have more than 50 AHEI points.

For the AHEI index, getting 5, 4, and 1 servings of veggies, fruit, and nuts per day is easy for me, so I’ve got 30 points so far. I eat oats once or twice/week, but not enough to get 9g of cereal fiber/day, so 0 points there. I eat 80 grams of sardines every day (560 grams/week), and ~150 grams of red meat per week, for a ratio of 3.7. That wouldn’t qualify me for 10 points, but 8 instead (see Quintile 4), where the white/red meat ratio would need to be higher than 2.5. I rarely drink alcohol, so 0 points for me there. Using last week’s dietary data, my P:S ratio is about 0.5, and my trans fat intake (almost exclusively from full-fat dairy) is 0.7 g/day, so I get 8 points and 10 points, respectively. In terms of multivitamin use, I only supplement with Vitamin D in the winter, and with a methylfolate-methylcobalamin-B6 stack (to reduce my homocysteine by ~10%). I haven’t been supplementing with that stack for more than five years, so I get a 0 there. Nonetheless, my score is 56 points, which would qualify me as having a high diet quality score.

Collectively, I have 4 of the 5 lifestyle factors that are associated with an increase in life expectancy. Based on the data from Li et al., my average life expectancy would be 85.4y. Adding in moderate alcohol intake would give me all 5 factors, and would result in a life expectancy gain of an additional 2.2 years. I’ve included 1-2 glasses of wine in my diet in the past, but it had no effect on my HDL or other circulating biomarkers, so I removed it. For me, the risk related to alcohol intake may not be worth the gain in life expectancy. Also note that these are average, population-based values, and I expect an additional gain in life expectancy gain because of my continuous quest for biological age optimization (https://michaellustgarten.wordpress.com/2019/09/09/quantifying-biological-age_!

References

Li Y, Pan A, Wang DD, Liu X, Dhana K, Franco OH, Kaptoge S, Di Angelantonio E, Stampfer M, Willett WC, Hu FB. Impact of Healthy Lifestyle Factors on Life Expectancies in the US Population. Circulation. 2018 Jul 24;138(4):345-355. doi: 10.1161/CIRCULATIONAHA.117.032047.

McCullough ML, Feskanich D, Stampfer MJ, Giovannucci EL, Rimm EB, Hu FB, Spiegelman D, Hunter DJ, Colditz GA, Willett WC. Diet quality and major chronic disease risk in men and womenmoving toward improved dietary guidanceAm J Clin Nutr. 2002 Dec;76(6):1261-71.

If you’re interested, please have a look at my book!

Optimizing Biological Age: RDW%

Can biological age be optimized? The red blood cell (RBC) distribution width (RDW%) is one of the variables included in the PhenoAge biological age calculator (see https://michaellustgarten.wordpress.com/2019/09/09/quantifying-biological-age/). Although the RDW% reference range is 11.5% – 14.5%, what values are optimal in terms a youthful biological age, and minimized disease risk?

First, let’s define RDW%. RDW% is calculated by dividing the standard deviation of the average mean corpuscular volume (i.e. the average volume inside red blood cells, defined as MCV, upper right panel; image via Danese et al. 2015). When the volume inside red blood cells is approximately the same across all RBCs (upper left panel), the RDW% will be narrow, as shown by the dashed line in the upper right panel.  Conversely, during aging and in many diseases, the size and volume of RBCs are altered, resulting in a more broad RDW% (bottom left and right panels):

ani

In terms of RDW%, what’s optimal for health and longevity? In the the largest study  (3,156,863 subjects) that investigated the association for risk of death for all causes with RDW%, maximally reduced risk of death was observed for RDW% between 11.4 – 12.5% (percentiles 1-5, 5-25), with mortality risk increasing for values < 11.3%, and > 12.6% (Tonelli et al. 2019):

rdw 2

This has been confirmed in other relatively large studies (240,477 subjects), as RDW% values < 12.5% were associated with maximally reduced all-cause mortality risk, with values > 12.5 associated with an increasing all-cause mortality risk (Pilling et al. 2018):

rdw 3

How does RDW% change during aging? For the 1,907 subjects of Lippi et al. (2014), RDW% increased during aging:

rdw 4

In support of this finding, RDW% also increased during aging in a larger study that included 8,089 subjects (Hoffmann et al. 2015).

Collectively, when considering the all-cause mortality and aging data, RDW% values ~ 12.5% may be optimal for health and longevity. What are my RDW% values? Plotted below are 18 RDW% measurements since 2015 (blue circles). First, note my average RDW% during that time (black line) is 12.8%, which isn’t far from the 12.5% that may be optimal for health and longevity. However, note the trend line (red), which indicates that my RDW% values are increasing during aging!

rdw 5

How do I plan on reducing my RDW%? A moderate strength correlation exists between my calorie intake with RDW% (r = 0.53), with a higher daily average calorie intake being associated with a higher RDW%:
my rdw
My plan is to shoot for a daily calorie intake ~2600 over the next month, and then retest my RDW% (and the rest of the CBC). Hopefully that brings my RDW% down to 12.5% or less. If that doesn’t work, I’ll re-calibrate, and try something else!

If you’re interested, please have a look at my book!

References

Danese E, Lippi G, Montagnana M. Red blood cell distribution width and cardiovascular diseasesJ Thorac Dis. 2015 Oct;7(10):E402-11. doi: 10.3978/j.issn.2072-1439.2015.10.04.

Hoffmann JJ, Nabbe KC, van den Broek NM. Red cell distribution width and mortality in older adults: a meta-analysis. Clin Chem Lab Med. 2015 Nov;53(12):2015-9. doi: 10.1515/cclm-2015-0155.

Lippi G, Salvagno GL, Guidi GC. Red blood cell distribution width is significantly associated with aging and gender. Clin Chem Lab Med. 2014 Sep;52(9):e197-9. doi: 10.1515/cclm-2014-0353.

Pilling LC, Atkins JL, Kuchel GA, Ferrucci L, Melzer D. Red cell distribution width and common disease onsets in 240,477 healthy volunteers followed for up to 9 years. PLoS One. 2018 Sep 13;13(9):e0203504. doi: 10.1371/journal.pone.0203504.

Tonelli M, Wiebe N, James MT, Naugler C, Manns BJ, Klarenbach SW, Hemmelgarn BR. Red cell distribution width associations with clinical outcomes: A population-based cohort studyPLoS One. 2019 Mar 13;14(3):e0212374. doi: 10.1371/journal.pone.0212374.

Drink Green Tea, Reduce All-Cause Mortality Risk?

Is green tea consumption associated with reduced risk of death risk from all causes? To investigate this question, Tang et al. (2015) performed a meta-analysis of 5 studies, including 200,884 subjects. As shown below, drinking 2-3 cups (16-24 oz.) of green tea per day was associated with maximally decreased all-cause mortality risk, ~10%.

green tea

Post update (9/15/2019): Is there new data since this post was first published (2015) for the association between green tea with all-cause mortality risk? Two relatively large studies have been published since then. First, in a study of 164,681 men (average age, ~53y), consuming green tea (~15g/day) was associated with a maximally reduced risk of death from all causes (black lines; Liu et al. 2016). However, note that this data included both smokers and non-smokers. For non-smokers (green lines), all-cause mortality risk was maximally reduced even further at smaller doses, including ~ 6-10g of green tea/day:

Screen Shot 2019-09-15 at 9.15.09 AM

In support of these data, never-smoking men and women (average age, ~52y) that drank more than  8.2g, and 3.3g, respectively, of green tea had an 11% reduced risk of all-cause mortality in Zhao et al. (2017).

The data is clear, drink green tea!

If you’re interested, please have a look at my book!

Reference

Liu J, Liu S, Zhou H, Hanson T, Yang L, Chen Z, Zhou M. Association of green tea consumption with mortality from all-cause, cardiovascular disease and cancer in a Chinese cohort of 165,000 adult men. Eur J Epidemiol. 2016 Sep;31(9):853-65.

Tang J, Zheng JS, Fang L, Jin Y, Cai W, Li D. Tea consumption and mortality of all cancers, CVD and all causes: a meta-analysis of eighteen prospective cohort studies. Br J Nutr. 2015 Jul 23:1-11.

Zhao LG, Li HL, Sun JW, Yang Y, Ma X, Shu XO, Zheng W, Xiang YB. Green tea consumption and cause-specific mortalityResults from two prospective cohort studies in ChinaJ Epidemiol. 2017 Jan;27(1):36-41.

Quantifying Biological Age

In an earlier post, I wrote about quantifying my biological age with aging.ai (https://michaellustgarten.wordpress.com/2018/06/26/maximizing-health-and-lifespan-is-calorie-restriction-essential/). The importance of that post is illustrated by the finding that based on data from 13 blood tests between 2016 – 2019, my average biological age is 29.2y, which is ~33% younger than my chronological age.

On my quest for optimal health, I’m striving to get as accurate as possible when it comes to quantifying biological age. While the aging.ai biomarker set is strongly correlated with biologic age (r = 0.80), in 2018 two papers were published (Liu et al., Levine et al.) that introduced “Phenotypic Age”, which includes a combination of 9 circulating biomarkers + chronological age that is better at predicting biological age (r = 0.94) than aging.ai. It includes analytes that are found on the standard blood chemistry screen, including albumin, creatinine, glucose, lymphocyte %, mean corpuscular volume (MCV), red blood cell distribution width (RDW), alkaline phosphatase, white blood cells, and an analyte that is not found on that panel, C-reactive protein (CRP). In addition, chronological age is included as a covariate.

So what’s my biological age based on the Phenotypic Age calculator? When I input my data from my latest blood test measurement on 6/4/2019, I get a biological age of 35.39y, which is 23% lower than my chronological age of 46. Not bad!

phenoage

To quantify your biological age with the Phenotypic Age calculator, input your data in the Excel file that is embedded within the first paragraph of the following link:

DNAmPhenoAge_gen

3.27.25 Edit: In the link above, note that the denominator in D17 should be 0.090165, not 0.09165. Additionally, the units for albumin should be g/dL (not mg/dL), and lymphocyte isn’t spelled correctly. I can’t upload a new link-I’d have to upgrade my WordPress account to be able to upload files (which is ridiculous!).

If you’re interested, please have a look at my book!

References

Liu Z, Kuo PL, Horvath S, Crimmins E, Ferrucci L, Levine M. A new aging measure captures morbidity and mortality riskacross diverse subpopulations from NHANES IV: A cohort studyPLoS Med. 2018 Dec 31;15(12):e1002718. doi: 10.1371/journal.pmed.1002718.

Levine ME, Lu AT, Quach A, Chen BH, Assimes TL, Bandinelli S, Hou L, Baccarelli AA, Stewart JD, Li Y, Whitsel EA, Wilson JG, Reiner AP, Aviv A, Lohman K, Liu Y, Ferrucci L, Horvath S. An epigenetic biomarker of aging for lifespan and healthspanAging (Albany NY). 2018 Apr 18;10(4):573-591. doi: 10.18632/aging.101414.

Tracking Deep Sleep-Can It Be Improved?

Deep sleep, the stage of sleep also known as “slow wave sleep” declines during aging. Based on a meta-analysis of 65 studies representing 3,577 subjects (aged 5 years to 102 years; Ohayon et al. 2004), slow wave sleep, expressed as a percentage of total sleep time decreases during aging from 25% in childhood to less than 10% in adults older than 65 years:Screen Shot 2019-02-16 at 5.14.10 PM.png Continue reading