What are the blood biomarkers of a centenarian, and is there room for improvement? Find out in the video below!

Blood Test Analysis In A 100 Year Old Subject
Leave a reply
What are the blood biomarkers of a centenarian, and is there room for improvement? Find out in the video below!

Here’s a video clip about my latest Biological Age measurement!


Interestingly, we recorded this as I was recovering from a respiratory infection. Was it SARS-CoV-2, or influenza? I’ll know later this week!

In the first 45 minutes, discuss each of the biomarkers contained within Levine’s Biological Age calculator, Phenotypic Age.
After that, I answer questions from the audience and we discuss all things related to aging.
In terms of all-cause mortality risk, is the reference range for circulating triglycerides (TG, <150 mg/dL) optimal?
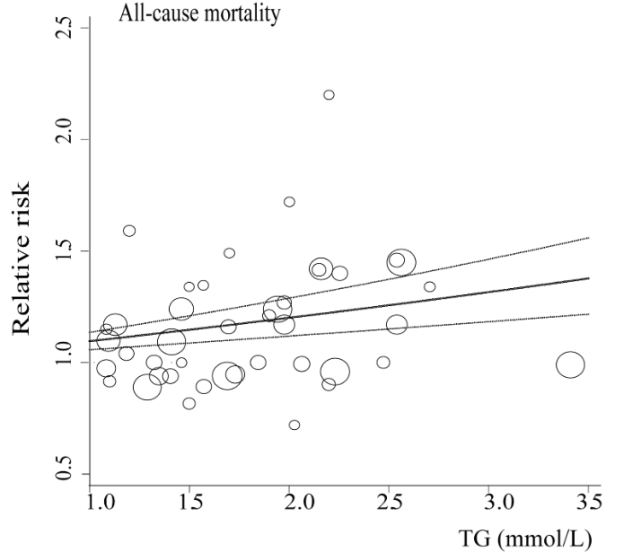
A meta-analysis of 38 studies in 360,556 subjects with a median age of 48y and a 12-year follow-up reported lowest all-cause mortality risk for subjects with TG values less than 90 mg/dL (equivalent to ~1 mmol; Liu et al. 2013). As shown below, each successive 90 mg/dL increase was associated with a 12% higher all-cause mortality risk. A person with a value closer to the high end of the reference range, ~150 would have a ~7% increased mortality risk compared someone with a value ~90. In other words, there would be 7 more deaths per 100 total people at a TG value of 150, compared with the death rate for people with values less than 90.

Added importance for the association between TG values less than 90 with all-cause mortality risk come from studies of people who have lived longer than 100 years, centenarians. As shown below, triglyceride values less than 101 mg/dL have been reported in 9 of 11 centenarian studies:

What’s my TG value? As shown below, I’ve measured triglycerides 23 times since 2015, with an average value of 52 mg/dL:
With the goal of keeping triglyceride levels low, are there dietary factors that influence it? When compared with my dietary data, the strongest correlation (r = 0.73, R2=0.5339) is present for triglycerides with my calorie intake. In other words, a higher daily calorie intake is associated with higher levels of triglycerides:

Based on this correlation, should my triglycerides start to rise in the future, a first step would be reducing my average daily calorie intake, which since October 2019 has been ~2550 calories/day.
If you’re interested, please have a look at my book!
References
Liu J, Zeng FF, Liu ZM, Zhang CX, Ling WH, Chen YM. Effects of blood triglycerides on cardiovascular and all-cause mortality: a systematic review and meta-analysis of 61 prospective studies. Lipids Health Dis. 2013 Oct 29;12:159.

Here’s a link to a recent interview,
Including:
And much more!
The reference range for uric acid is 4.0 – 8 mg/dL for men, and 2.5 – 7 mg/dL for women. Are these values optimal for health? To answer that question, let’s have a look at how circulating levels of uric acid change during aging, and their association with risk of death for all causes.
Uric acid increases during aging in both men and women. Kuzuya et al. (2002) studied how uric acid changes during a 10-year intervals for various birth cohorts, including 32yr olds, 39yr olds, 47yr olds, 56yr olds, and 65 yr olds (1960-1969, 1950-1959, 1940-1949, 1930-1939, 1920-1929 birth cohorts, respectively). For each birth cohort, uric acid levels increased during aging for men (left image below), whereas they increased for women starting at 40 years old:

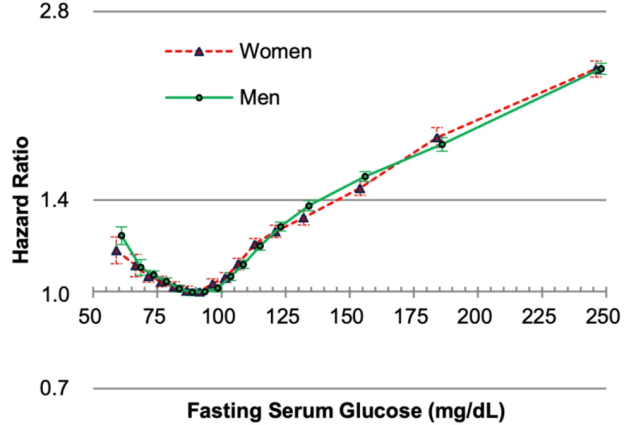
In terms of mortality risk, lowest risk of death for all causes was associated with uric acid levels of 5 – 7 mg/dL for men and 4 – 6 mg/dL for women in the 9,118 adults (average age, 43y) of Hu et al. (2019). Also note the U-shaped curve for both genders, whereas mortality risk increases at both low and high levels of uric acid:

Similarly, the lowest risk of death for all causes was associated with uric acid levels of 7 mg/dL for men, and 4 mg/dL for women in the 375,163 adults (average age, 40y) of Cho et al. (2018), with mortality risk significantly increasing at uric levels < 3.5 and > 9.5 mg/dL for men, < 2.5 and > 7.5 mg/dL for women. Collectively, these 2 studies in middle-aged adults suggest that uric acid levels ~ 4 mg/dL for women and ~7 for men may be optimal for reducing risk of disease for all causes. It’s also important to note that both low and higher values are associated with an increased mortality risk.
The data for the Hu and Chu studies are in younger adults, so how does the data look in older adults? Lowest all-cause mortality risk was associated with uric acid levels between 4 – 5 mg/dL in the 121, 771 older adults (average age, 73y) of Tseng et al. (2018), with mortality risk significantly increasing below 4 and > 8:

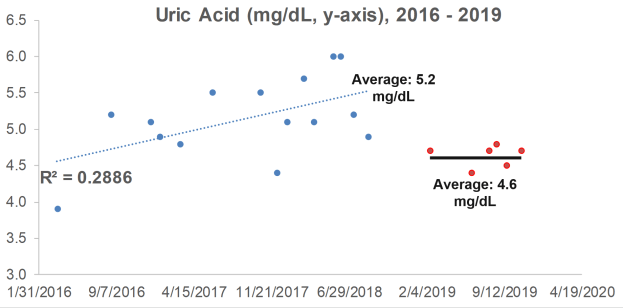
What are my uric acid levels? From 2016 to 2018, I measured it 15x, and although my average value of 5.2 mg/dL is not too low or too high in terms of an increased all-cause mortality risk, it increased during that 3-year period (R2 = 0.2886). When considering that uric acid increases during aging, can I reduce it with diet?

Because I track my daily nutritional intake, I can look for correlations between my dietary intake with circulating biomarkers. Interestingly, a moderately strong correlation between my lycopene intake with uric acid (R2 = 0.3343, p=0.024) was present from 2016 to 2018:

Lycopene is found almost exclusively in tomatoes and watermelon. If these foods are related to my increasing levels of uric acid, if I ate less of them, I’d expect to see a corresponding decrease in uric acid. So, in 2019, I ate less of these foods, thereby reducing my average lycopene intake from 11,585 to 9,132 micrograms per day. How did that affect circulating levels of uric acid?
In 6 measurements for 2019, my average uric acid level was 4.6 mg/dL, a value that was significantly different (p=0.02) from the 2016-2018 average of 5.2 mg/dL. Whether eating less watermelon and tomatoes caused the decrease is unknown, but it’s good to know that uric acid can be potentially modified with dietary change!

If you’re interested, please have a look at my book!
References
Cho SK, Chang Y, Kim I, Ryu S. U-Shaped Association Between Serum Uric Acid Level and Risk of Mortality: A Cohort Study. Arthritis Rheumatol. 2018 Jul;70(7):1122-1132. doi: 10.1002/art.40472.
Hu L, Hu G, Xu BP, Zhu L, Zhou W, Wang T, Bao H, Cheng X. U-Shaped Association of Serum Uric Acid with All-cause and Cause-Specific Mortality in US Adults: A Cohort Study. J Clin Endocrinol Metab. 2019 Oct 25. pii: dgz068. doi: 10.1210/clinem/dgz068.
Kuzuya M, Ando F, Iguchi A, Shimokata H. Effect of aging on serum uric acid levels: longitudinal changes in a large Japanese population group. J Gerontol A Biol Sci Med Sci. 2002 Oct;57(10):M660-4.
Tseng WC, Chen YT, Ou SM, Shih CJ, Tarng DC; Taiwan Geriatric Kidney Disease (TGKD) Research Group. U-Shaped Association Between Serum Uric Acid Levels With Cardiovascular and All-Cause Mortality in the Elderly: The Role of Malnourishment. J Am Heart Assoc. 2018 Feb 10;7(4). pii: e007523. doi: 10.1161/JAHA.117.007523.
Creatinine is one of the 9 blood test variables included on the biological age calculator, Phenotypic Age (https://michaellustgarten.wordpress.com/2019/09/09/quantifying-biological-age/). The reference range for women and men is 0.5 – 1.1, and 0.6 – 1.2 mg/dL respectively, but within that range, what’s optimal for health and longevity?
To answer that question, it’s important to know how circulating levels of creatinine change during aging, and its association with risk of death for all causes. Creatinine increases during aging, as reported in studies of 9,389 adults (age range, 30 – 75y; Levine 2013), and in 377,686 subjects (age range, 18 – 85y; Wang et al. 2017). However, the absolute values for these changes, i.e. from 0.8 to 1.0 mg/dL, for ex., was not reported in either study.
In terms of all-cause mortality risk, creatinine levels of 0.8 mg/dL (blue line; 95% confidence interval (CI), red dotted line) were associated with the lowest risk of death for all causes, with risk being significantly reduced for creatinine values between 0.6 – 1.1 mg/dL in the 30,760 older adults (median age, 69y) of Solinger and Rothman (2013):
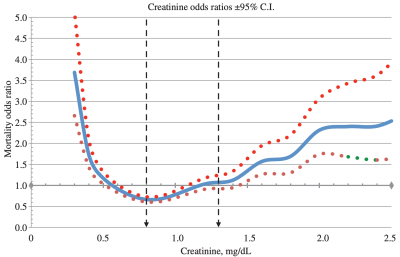
Note the U-shaped mortality curve for creatinine: all-cause mortality increased when it was both less than or greater than 0.8 mg/dL. More specifically, risk of death for all causes was significantly increased when serum levels of creatinine were less than ~0.55 and greater than 1.5 mg/dL.
Few studies have investigated the association between serum (or plasma) levels of creatinine with all-cause mortality risk, as most studies use creatinine in conjunction with chronological age, gender, and ethnicity to estimate kidney function (eGFR). For example, the MDRD equation (Levey et al. 2006) is commonly used to calculate eGFR, and if you’re interested in converting your creatinine levels into eGFR, here’s a link to calculate it (https://www.mdcalc.com/mdrd-gfr-equation). As creatinine goes up, eGFR goes down, and is indicative of worse kidney function. Based on that, we should expect to see an age-related decrease in kidney function, as measured by eGFR. Is this true?
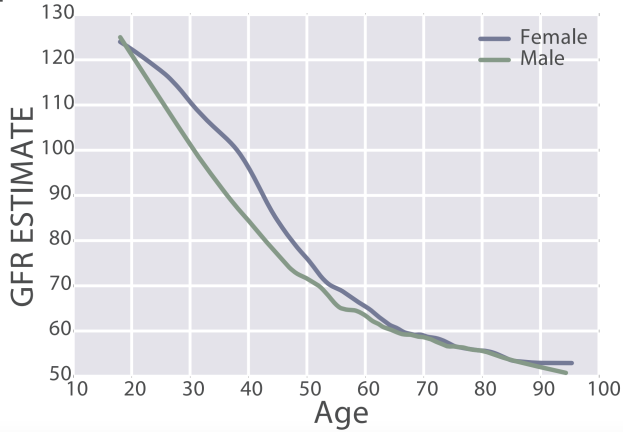
eGFR decreases during aging, from values ~125 in 20 year old women and men to ~50 mL/min/1.73m^2 in adults older than 90y in the 385,918 subjects (age range, 18 – 100y) of Wang et al. (2017):

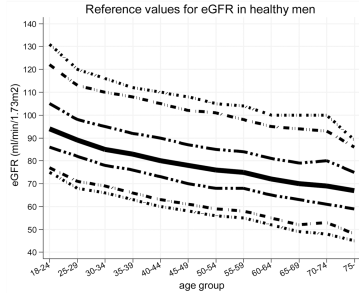
Similarly, eGFR decreased from ~90 (thick black line; 95% CI, dashed lines: 75 – 130 mL/min/1.73m^2) in young men (18-24y) to less than 70 (thick black line; 95% CI, dashed lines: 45 – 90 mL/min/1.73m^2) in men older than 75y (Baba et al. 2015):
In women, eGFR decreased from values ~100 (thick black line; 95% CI, dashed lines: 70 – 135 mL/min/1.73m^2) in youth to ~70 (thick black line; 95% CI, dashed lines: 50 – 95 mL/min/1.73m^2) in women older than 75y (Baba et al. 2015):

Similar findings have been reported for the age-related decline in eGFR in other studies, including Wetzels et al. (2007). When comparing young adults (18-24 year olds) with older adults (> 85y), median eGFR values declined from ~95 to ~65 mL/min/1.73m^2 in men, and from ~90 to ~60 mL/min/1.73m^2 in women.
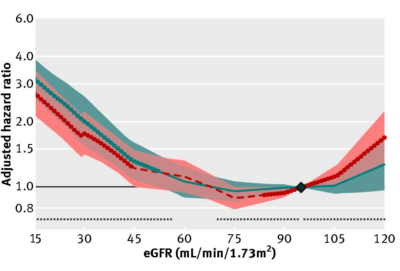
What’s the effect of reduced kidney function (i.e. increased creatinine, decreased eGFR) on risk of death for all causes? In a meta-analysis of 46 studies that included 2,051,158 subjects, risk of death for all causes was significantly increased when eGFR was less than 52 in women (red, below), and less than 44 in men (blue), when compared with eGFR values between 90 – 104 mL/min/1.73m^2 (95 was used as the reference; Nitsch et al. 2013):
In sum, creatinine increases during aging, which is associated with an increased all-cause mortality risk. Similarly, eGFR, which includes circulating values for creatinine, decreases during aging, and is also associated with an increased all-cause mortality risk. Therefore, if you’re tracking your creatinine levels with the goal of optimizing your biological age, it’s important to try to keep creatinine levels relatively low (i.e. around 0.8 mg/dL), and to avoid its age-related increase!
If you’re interested, please have a look at my book!
References
Baba M, Shimbo T, Horio M, Ando M, Yasuda Y, Komatsu Y, Masuda K, Matsuo S, Maruyama S. Longitudinal Study of the Decline in Renal Function in Healthy Subjects. PLoS One. 2015 Jun 10;10(6):e0129036.
Levey AS, Coresh J, Greene T, Stevens LA, Zhang YL, Hendriksen S, Kusek JW, Van Lente F; Chronic Kidney Disease Epidemiology Collaboration. Using standardized serum creatinine values in the modification of diet in renal disease study equation for estimating glomerular filtration rate. Ann Intern Med. 2006 Aug 15;145(4):247-54.
Levine ME. Modeling the rate of senescence: can estimated biological age predict mortality more accurately than chronological age? J Gerontol A Biol Sci Med Sci. 2013 Jun;68(6):667-74. doi: 10.1093/gerona/gls233.
Nitsch D, Grams M, Sang Y, Black C, Cirillo M, Djurdjev O, Iseki K, Jassal SK, Kimm H, Kronenberg F, Oien CM, Levey AS, Levin A, Woodward M, Hemmelgarn BR; Chronic Kidney Disease Prognosis Consortium. Associations of estimated glomerular filtration rate and albuminuria with mortality and renal failure by sex: a meta-analysis. BMJ. 2013 Jan 29;346:f324. doi: 10.1136/bmj.f324.
Solinger AB, Rothman SI. Risks of mortality associated with common laboratory tests: a novel, simple and meaningful way to set decision limits from data available in the Electronic Medical Record. Clin Chem Lab Med. 2013 Sep;51(9):1803-13. doi: 10.1515/cclm-2013-0167.
Wang Z, Li L, Glicksberg BS, Israel A, Dudley JT, Ma’ayan A. Predicting age by mining electronic medical records with deep learning characterizes differences between chronological and physiological age. J Biomed Inform. 2017 Dec;76:59-68. doi: 10.1016/j.jbi.2017.11.003.
Wetzels JF, Kiemeney LA, Swinkels DW, Willems HL, den Heijer M. Age– and gender-specific reference values of estimated GFR in Caucasians: the Nijmegen Biomedical Study. Kidney Int. 2007 Sep;72(5):632-7.
