If you’re interested, please have a look at my book!
If you’re interested, please have a look at my book!
If you’re interested, please have a look at my book!
Video of my presentation starts at 14:28, and lasts until 1:29:00+!
If you’re interested, please have a look at my book!

If you’re interested, please have a look at my book!
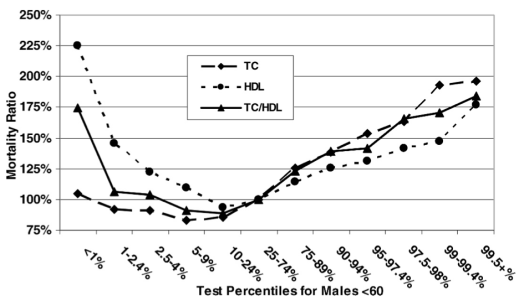
On my latest blood test (August 2015), my total cholesterol was 127 mg/dL-is that value optimal for health and longevity?
Based on data for 1,104,294 men younger than 60y (median age, 40y) that were followed for up to 14 years (Fulks et al. 2009), my 127 mg/dL value (1 – 2.4%) puts me relatively close to maximally reduced all-cause mortality risk, which occurs at 146-158 mg/dL (5-9% on the graph below):
But what about the data for men older than 60?
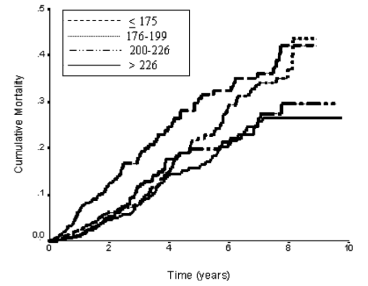
In a 10-year study of 2,277 older adults (average age, ~77y), total cholesterol levels less than 175 mg/dL were associated with ~2-fold higher risk of all-cause mortality, compared with values greater than 226 mg/dL (Schupf et al. 2005):
Similarly, in a 10-year study of even older adults (median age, 89y; 724 subjects), all-cause mortality risk was significantly increased in subjects with total cholesterol values less than 193 mg/dL (dark black line below), compared with values greater than 251 mg/dL (dashed line; Weverling-Rijnsburger et al. 1997). In addition, subjects with cholesterol values greater than 251 mg/dL lived ~2 years longer than those with values less than 191 mg/dL. So higher cholesterol in very old adults…increased lifespan! Does that mean I should alter my dietary approach to increase my circulating cholesterol levels after I reach 60?
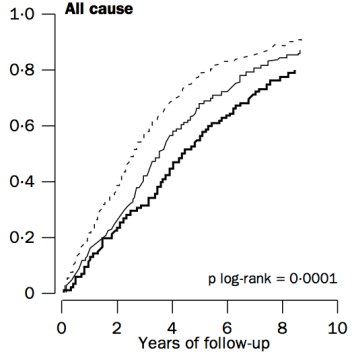
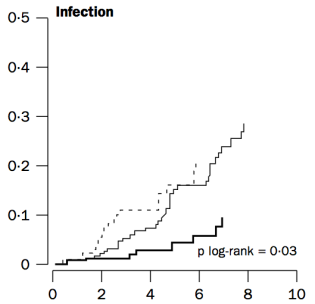
To address that issue, it’s important to understand why cholesterol increases during aging. One possible mechanism involves the role of cholesterol in immune defense against infectious agents (bacteria, viruses, parasites, etc.). Obviously, our immune system is supposed to eliminate these pathogens, but immune function decreases with age (Targonski et al. 2007). As a compensatory mechanism, cholesterol can protect against infectious agents. For example, LDL cholesterol binds to and partially inactivates Staphylococcus aureus (Bhakdi et al. 1983). Staphylococcus aureus infection increases during aging, as its incidence rate is ~3-fold higher in adults older than 60y, when compared with younger subjects (Laupland et al. 2008). In addition, LDL cholesterol inhibits bacterial endotoxin (Weinstock et al. 1992), whose presence in the blood increases during aging (Ghosh et al. 2015). In support of the link between circulating cholesterol with infectious agents, in the older adults of Weverling-Rijnsburger et al. (1997), cholesterol values greater than 251 mg/dL (solid black line) were associated with significantly decreased infectious disease-related mortality, when compared with values less than 193 mg/dL:
So if we’re better able to keep infectious agents out of our blood, that would be expected to reduce the need for elevated circulating cholesterol during aging. How can we do that?
One approach involves increased dietary fiber. Fermentation of dietary fiber by gut bacteria produces short-chain fatty acids, which improve gut barrier function (Chen et al. 2013), and decrease cholesterol synthesis (Wright et al. 1990). However, older adults do not eat high-fiber diets, as values of only ~19g/day have been reported (Lustgarten et al. 2014). In contrast, dietary fiber intakes greater than only 29g/day are associated with less infectious disease (and all-cause mortality) risk (Park et al. 2011). So definitely eating at least 29g fiber/day is important, but is that amount optimal to minimize the need for elevated cholesterol during aging?
In a 2-week study of the role of dietary fiber on circulating cholesterol, subjects that ate only 10g fiber/1000 calories did not significantly reduce their baseline total cholesterol values from ~182 mg/dL (Jenkins et al. 2001). In contrast, a dietary fiber intake of 19g/1000 calories reduced baseline total cholesterol from 185 to 150 mg/dL, and subjects that ate even more fiber than that, 55g/1000 calories reduced their total cholesterol values from ~182 to 142 mg/dL, a drop that was also significantly different compared with the 19g fiber/1000 calorie group.
Collectively, these data suggest that to maximally boost gut barrier function, thereby minimizing circulating infectious agents and the need for elevated circulating cholesterol during aging, a very-high fiber-diet may be important. Accordingly, my average daily fiber intake is ~100 g/day on a 2300 calorie diet, resulting in ~43g fiber/1000 calories. Based on this, I don’t expect for my total cholesterol values to change during aging, as my gut barrier function will be optimal, and infectious agents in my blood will be minimized.
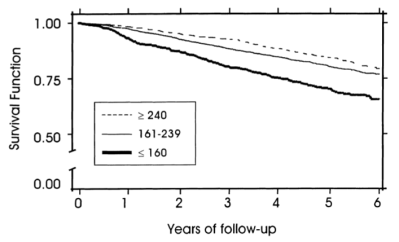
To add some specificity to this approach, 2 additional measurements may be important: serum albumin and HDL cholesterol. In agreement with the studies of Weverling-Rijnsburger et al. and Schupf et al., in a 5-year study of 4,128 older adults (average age, ~79y), those with total cholesterol values less than 160 mg/dL had significantly higher all-cause mortality risk, compared with values greater than 240 mg/dL (Volpato et al. 2001):
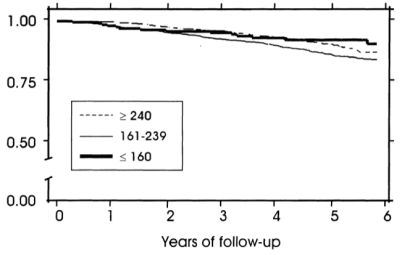
However, when considering subjects’ albumin and HDL cholesterol levels, the differential mortality risk was abolished. Subjects that had low total cholesterol but also high (within-range) albumin and HDL had improved survival compared to the higher cholesterol groups:
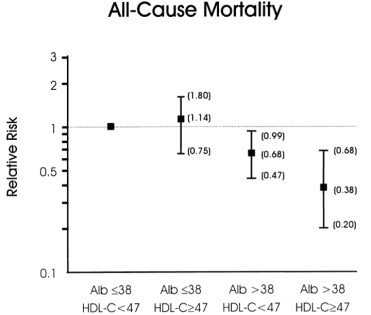
If your total cholesterol values are less than 160 mg/dL, what serum albumin and HDL values should you shoot for? As shown below, albumin levels greater than 38 g/L and HDL values greater than 47 mg/dL were associated with maximally reduced all-cause mortality risk in subjects with total cholesterol values less than 160 mg/dL (Volpato et al. 2001):
My albumin values are consistently between 46-48 g/L, but during recent measurements my HDL levels have been lower than optimal (35 mg/dL on 8/2015). The good news is that I was able to increase my HDL from 28 (7/2013 measurement) to 35 mg/dL by adding ~4 oz of fish every day! To further increase my HDL, I’ve doubled my fish oil intake (~3.3 g of combined EPA + DHA per day, from 5-9 g of cod liver oil). I’ll test the effect of this on my circulating biomarkers in a couple of months, so stay tuned!
3/23/2016 Update: Because of concerns that the pre-formed Vitamin A (that is found in cod liver oil) may negate the potential health-promoting effects of optimal Vitamin D levels (Schmutz et al. 2016), I stopped taking cod liver oil during the 3-month period that preceded my latest blood test (3/23/2016). However, I was able to increase my HDL from 35 to 53 mg/dL! I attribute this increase to the daily inclusion of ~60g/walnuts per day. In doing that, although I only replaced ~200 calories from carbohydrates with fat, lower carbohydrate diets have been shown to increase HDL (Manor et al. 2016).
Nonetheless, in terms of the all-cause mortality data that includes total cholesterol (137 mg/dL), albumin (51 g/L), and HDL (53 mg/dL), based on my latest blood test results, my risk is now maximally low!
If you’re interested, please have a look at my book!
References
Bhakdi S, Tranum-Jensen J, Utermann G, Füssle R. Binding and partial inactivation of Staphylococcus aureus alpha-toxin by human plasma low density lipoprotein. J Biol Chem. 1983 May 10;258(9):5899-904.
Chen H, Mao X, He J, Yu B, Huang Z, Yu J, Zheng P, Chen D. Dietary fibre affects intestinal mucosal barrier function and regulates intestinal bacteria in weaning piglets. Br J Nutr. 2013 Nov;110(10):1837-48.
Eaton SB, Eaton SB 3rd, Konner MJ. Paleolithic nutrition revisited: A twelve-year retrospective on its nature and implications. Eur J Clin Nutr. 1997 Apr;51(4):207-16.
Fulks M, Stout RL, Dolan VF. Association of cholesterol, LDL, HDL, cholesterol/ HDL and triglyceride with all-cause mortality in life insurance applicants. J Insur Med. 2009;41(4):244-53.
Ghosh S, Lertwattanarak R, Garduño Jde J, Galeana JJ, Li J, Zamarripa F, Lancaster JL, Mohan S, Hussey S, Musi N. Elevated muscle TLR4 expression and metabolic endotoxemia in human aging. J Gerontol A Biol Sci Med Sci. 2015 Feb;70(2):232-46.
Jenkins DJ, Kendall CW, Popovich DG, Vidgen E, Mehling CC, Vuksan V, Ransom TP, Rao AV, Rosenberg-Zand R, Tariq N, Corey P, Jones PJ, Raeini M, Story JA, Furumoto EJ, Illingworth DR, Pappu AS, Connelly PW. Effect of a very-high-fiber vegetable, fruit, and nut diet on serum lipids and colonic function. Metabolism. 2001 Apr;50(4):494-503.
Laupland KB, Ross T, Gregson DB. Staphylococcus aureus bloodstream infections: risk factors, outcomes, and the influence of methicillin resistance in Calgary, Canada, 2000-2006. J Infect Dis. 2008 Aug 1;198(3):336-43.
Lustgarten MS, Price LL, Chalé A, Fielding RA. Metabolites related to gut bacterial metabolism, peroxisome proliferator-activated receptor-alpha activation, and insulin sensitivity are associated with physical function in functionally-limited older adults. Aging Cell. 2014 Oct;13(5):918-25.
Mansoor N, Vinknes KJ, Veierød MB, Retterstøl K. Effects of low-carbohydrate diets v. low-fat diets on body weight and cardiovascular risk factors: a meta-analysis of randomised controlled trials. Br J Nutr. 2016 Feb;115(3):466-79.
Park Y, Subar AF, Hollenbeck A, Schatzkin A. Dietary fiber intake and mortality in the NIH-AARP diet and health study. Arch Intern Med. 2011 Jun 27;171(12):1061-8.
Schmutz EA, Zimmermann MB, Rohrmann S. The inverse association between serum 25-hydroxyvitamin D and mortality may be modified by vitamin A status and use of vitamin A supplements. Eur J Nutr. 2016 Feb;55(1):393-402.
Schupf N, Costa R, Luchsinger J, Tang MX, Lee JH, Mayeux R. Relationship Between Plasma Lipids and All-Cause Mortality in Nondemented Elderly. J Am Geriatr Soc. 2005 Feb;53(2):219-26.
Targonski PV, Jacobson RM, Poland GA. Immunosenescence: role and measurement in influenza vaccine response among the elderly. Vaccine. 2007 Apr 20;25(16):3066-9.
Vasto S, Scapagnini G, Rizzo C, Monastero R, Marchese A, Caruso C. Mediterranean diet and longevity in Sicily: survey in a Sicani Mountains population. Rejuvenation Res. 2012 Apr;15(2):184-8.
Volpato S, Leveille SG, Corti MC, Harris TB, Guralnik JM. The value of serum albumin and high-density lipoprotein cholesterol in defining mortality risk in older persons with low serum cholesterol. J Am Geriatr Soc. 2001 Sep;49(9):1142-7.
Weinstock C, Ullrich H, Hohe R, Berg A, Baumstark MW, Frey I, Northoff H, Flegel WA. Low density lipoproteins inhibit endotoxin activation of monocytes. Arterioscler Thromb. 1992 Mar;12(3):341-7.
Weverling-Rijnsburger AW, Blauw GJ, Lagaay AM, Knook DL, Meinders AE, Westendorp RG. Total cholesterol and risk of mortality in the oldest old. Lancet. 1997 Oct 18;350(9085):1119-23.
Wright RS, Anderson JW, Bridges SR. Propionate inhibits hepatocyte lipid synthesis. Proc Soc Exp Biol Med. 1990 Oct;195(1):26-9.

How much Vitamin D is optimal for health? To answer this question, today I’ll examine the association between a circulating marker of Vitamin D, 25-hydroxyvitamin D, with all-cause mortality risk. Then, I’ll examine the literature to estimate a dietary intake that can achieve an optimal circulating 25-hydroxyvitamin D concentration.
Circulating 25-hydroxyvitamin D is the most commonly measured vitamin D metabolite because of its greater half life (~3 weeks) and up to 1000-fold higher serum levels compared with the physiologically active metabolite of vitamin D, 1,25-dihydroxyvitamin D (Zerwekh 2008). So what’s the evidence for the association between circulating 25-hydroxyvitamin D with all-cause mortality risk?
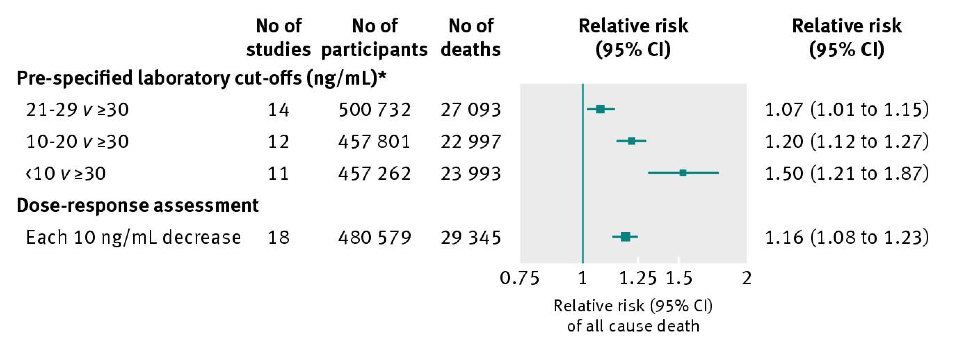
In a meta-analysis of 95 studies including 880,201 subjects, circulating 25-hydroxyvitamin D levels greater than 30 ng/mL (75 nmol/L) are associated with significantly reduced risk of death from all causes when compared with values less than 30 (<10, 20-29; Chowdhury et al. 2014):
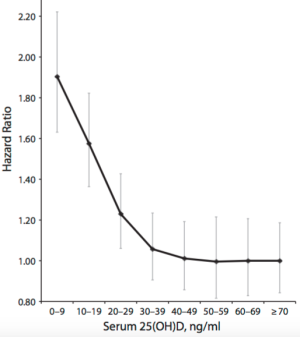
Does the meta-analysis data for 25-hydroxyvitamin D mean that any values higher than 30 ng/mL are optimal for health? Maybe not. As shown below, although data from 11,315 subjects in the NHANES III study suggests that values between 30-40 ng/mL (75-99 nmol/L) may be optimal for decreased all-cause mortality risk (Sempos et al. 2013), 25-hydroxyvitamin D values greater than 48 ng/mL (120+ nmol/L) were associated with an increased all-cause mortality risk. Interestingly, in agreement with the Chowdhury meta-analysis data, this graph shows also increased mortality risk at values less than 30-40 ng/mL (75-99 nmol/L):

However, whether increased circulating 25-hydroxyvitamin D is associated with increased all-cause mortality risk is debatable. In another meta-analysis (Garland et al. 2014), although circulating 25-hydroxyvitamin D values less than 30 ng/mL were again associated with increased risk, in contrast, values greater than 48 ng/mL were not. Interestingly, values as high as 70 ng/mL (175 nmoL) were not associated with increased risk, either:
Aside from our skin making Vitamin D from sunlight during the summer months, what dietary intake can achieve the seemingly optimal 30-40 ng/mL (75-99 nmol/L) concentration for 25-hydroxyvitamin D in the winter? The RDA for Vitamin D is 600 IU for everyone older than 1 but younger than 70 (Institute of Medicine, 2010). If you’re over 70, the RDA is 800 IU. My average dietary intake is only ~170 IU-how can I increase this to at least the RDA, to achieve circulating values between 75-99 nmol/L?
Decent dietary sources of vitamin D include fish: salmon, sardines, mackerel, and tuna. Based on the table below (Holick 2007), eating ~3.5 ounces of wild salmon every day would achieve the RDA for vitamin D intake. In contrast, my daily tin of sardines puts me ~300 IU away from the RDA value! I could double my fish intake to ~8 oz./day, but I’d like to limit my animal protein intake, and, the extra ~200 calories would limit other nutrients that I’d like to enrich in my diet, like fiber.

Are there other, less calorie dense dietary sources of vitamin D? It’s important to note that dietary vitamin D can be found in 2 forms, D3, which is shown above, and D2. Which foods are rich in vitamin D2? Shown below is a picture of the best plant-based source of vitamin D2, maitake mushrooms:

The Vitamin D2 content of maitake mushrooms is 36 IU/calorie, whereas wild salmon only has 3.2 IU of vitamin D per calorie! Other “exotic” mushrooms (anything other than white button mushrooms is exotic to me!) like Chanterelle and Morel contain decent amounts of vitamin D2:

Before adding maitake and other “exotic” mushrooms into my nutritional plan for their vitamin D content, it’s important to ask, “does D2 increase circulating 25-hydroxyvitamin D to an equal extent as D3”? Unfortunately, the answer is no: although D2 and D3 both increase circulating 25-hydroxyvitamin D levels, D2-based sources increase 25-hydroxyvitamin D level about half as effectively as D3 (Trang et al. 1998). So, instead of consuming ~35g of maitake mushrooms to add 400 IU of vitamin D into my diet (to achieve the RDA of 600 IU), I’ve added ~70g/day.
12/29/2015 Update: Because of Maitake’s relatively high cost, $5 for only 100g, and the burden of having to eat it every day, for the past ~3 months I switched to Vitamin D supplements to achieve a D intake of ~1100 IU/day. Blood testing showed that this intake yielded a circulating 25-hydroxyvitamin D winter concentration of 31 ng/mL, putting me at low risk for all cause mortality, based on the meta-analysis D data.
8/23/2016 Update: I stopped supplementing with 1000 IU of Vitamin D in June 2016, to explore the effect of 3-4 hours of weekly sun exposure on my circulating Vitamin D levels. My unsupplemented, circulating 25-hydroxyvitamin D level was 41 ng/mL in my 8/2016 blood test. Accordingly, I intend on increasing my Vitamin D intake to 1600 IU (1400 supplemental, ~200 dietary)/day to achieve a circulating winter 25-hydroxyvitamin D level that is similar my the summer value.
11/12/2017 Update: I’ve been supplementing with 2000 IU of D3/day, bringing my average daily total to ~2200 IU/day. Based on that, my latest circulating 25-hydroxyvitamin D level (tested in October, 2017) was 39 ng/mL .
If you’re interested, please have a look at my book!
References
Chowdhury R, Kunutsor S, Vitezova A, Oliver-Williams C, Chowdhury S, Kiefte-de-Jong JC, Khan H, Baena CP, Prabhakaran D, Hoshen MB, Feldman BS, Pan A, Johnson L, Crowe F, Hu FB, Franco OH. Vitamin D and risk of cause specific death: systematic review and meta-analysis of observational cohort and randomised intervention studies. BMJ. 2014 Apr 1;348:g1903.
Garland CF, Kim JJ, Mohr SB, Gorham ED, Grant WB, Giovannucci EL, Baggerly L, Hofflich H, Ramsdell JW, Zeng K, Heaney RP. Meta-analysis of all-cause mortality according to serum 25-hydroxyvitamin D. Am J Public Health. 2014 Aug;104(8):e43-50.
Holick MF. Vitamin D deficiency. N Engl J Med. 2007 Jul 19;357(3):266-81.
Institute of Medicine, Food and Nutrition Board. Dietary Reference Intakes for Calcium and Vitamin D. Washington, DC: National Academy Press, 2010.
Sempos CT, Durazo-Arvizu RA, Dawson-Hughes B, Yetley EA, Looker AC, Schleicher RL, Cao G, Burt V, Kramer H, Bailey RL, Dwyer JT, Zhang X, Gahche J, Coates PM, Picciano MF. Is there a reverse J-shaped association between 25-hydroxyvitamin D and all-cause mortality? Results from the U.S. nationally representative NHANES. J Clin Endocrinol Metab. 2013 Jul;98(7):3001-9.
Trang HM, Cole DE, Rubin LA, Pierratos A, Siu S, Vieth R. Evidence that vitamin D3 increases serum 25-hydroxyvitamin D more efficiently than does vitamin D2. Am J Clin Nutr. 1998 Oct;68(4):854-8.
Zerwekh JE. Blood biomarkers of vitamin D status. Am J Clin Nutr 2008;87:1087S-91S.
In terms of all-cause mortality risk, is the reference range for circulating triglycerides (TG, <150 mg/dL) optimal?
A meta-analysis of 38 studies in 360,556 subjects with a median age of 48y and a 12-year follow-up reported lowest all-cause mortality risk for subjects with TG values less than 90 mg/dL (equivalent to ~1 mmol; Liu et al. (2013)). As shown below, each successive 90 mg/dL increase was associated with a 12% higher all-cause mortality risk. A person with a value closer to the high end of the reference range, ~150 would have a ~7% increased mortality risk compared someone with a value ~90. In other words, there would be 7 more deaths per 100 total people at a TG value of 150, compared with the death rate for people with values less than 90.

Added importance for the association between TG values less than 90 with all-cause mortality risk come from studies of people who have lived longer than 100 years, centenarians. As shown below, triglyceride values less than 101 mg/dL have been reported in 9 of 11 centenarian studies:

What’s my TG value? On my latest blood test (8/2015), it was 42. I’ve measured my TGs 11 times over the past 10 years-my average value for those measurements is 62. Based on the meta-analysis and centenarian data, that would put me in the lowest risk category for all-cause mortality.

If you’re interested, please have a look at my book!
References
Arai Y, Hirose N, Yamamura K, Shimizu K, Takayama M, Ebihara Y, Osono Y. Serum insulin-like growth factor-1 in centenarians: implications of IGF-1 as a rapid turnover protein. J Gerontol A Biol Sci Med Sci. 2001 Feb;56(2):M79-82.
Baranowska B, Bik W, Baranowska-Bik A, Wolinska-Witort E, Szybinska A, Martynska L, Chmielowska M. Neuroendocrine control of metabolic homeostasis in Polish centenarians. J Physiol Pharmacol. 2006 Nov;57 Suppl 6:55-61.
Barbagallo CM, Averna MR, Frada G, Noto D, Cavera G, Notarbartolo A. Lipoprotein profile and high-density lipoproteins: subfractions distribution in centenarians. Gerontology 1998;44(2):106–10.
Bik W, Baranowska-Bik A, Wolinska-Witort E, Kalisz M, Broczek K, Mossakowska M, Baranowska B. Assessment of adiponectin and its isoforms in Polish centenarians. Exp Gerontol. 2013 Apr;48(4):401-7.
Chan YC, Suzuki M, Yamamoto S. Dietary, anthropometric, hematological and biochemical assessment of the nutritional status of centenarians and elderly people in Okinawa, Japan. J Am Coll Nutr. 1997 Jun;16(3):229-35.
Chan YC, Suzuki M, Yamamoto S. A comparison of anthropometry, biochemical variables and plasma amino acids among centenarians, elderly and young subjects. J Am Coll Nutr. 1999 Aug;18(4):358-65.
Liu J, Zeng FF, Liu ZM, Zhang CX, Ling WH, Chen YM. Effects of blood triglycerides on cardiovascular and all-cause mortality: a systematic review and meta-analysis of 61 prospective studies. Lipids Health Dis. 2013 Oct 29;12:159.
Magri F, Muzzoni B, Cravello L, Fioravanti M, Busconi L, Camozzi D, Vignati G, Ferrari E. Thyroid function in physiological aging and in centenarians: possible relationships with some nutritional markers. Metabolism. 2002 Jan;51(1):105-9.
Paolisso G, Ammendola S, Del Buono A, Gambardella A, Riondino M, Tagliamonte MR, Rizzo MR, Carella C, Varricchio M. Serum levels of insulin-like growth factor-I (IGF-I) and IGF-binding protein-3 in healthy centenarians: relationship with plasma leptin and lipid concentrations, insulin action, and cognitive function. J Clin Endocrinol Metab. 1997 Jul;82(7):2204-9.
Thillet J, Doucet C, Chapman J, Herbeth B, Cohen D, Faure-Delanef L. Elevated lipoprotein(a) levels and small apo(a) isoforms are compatible with longevity: evidence from a large population of French centenarians. Atherosclerosis 1998;136:389–94.
Vasto S, Scapagnini G, Rizzo C, Monastero R, Marchese A, Caruso C. Mediterranean diet and longevity in Sicily: survey in a Sicani Mountains population. Rejuvenation Res. 2012 Apr;15(2):184-8.
Willcox DC, Willcox BJ, Wang NC, He Q, Rosenbaum M, Suzuki M. Life at the extreme limit: phenotypic characteristics of supercentenarians in Okinawa. J Gerontol A Biol Sci Med Sci. 2008 Nov;63(11):1201-8.

Two blood markers of liver health are aspartate aminotransaminase (AST) and alanine aminotransaminase (ALT). AST and ALT are proteins that are usually found inside liver cells, but when there is liver cell damage, they’re released into the blood. It’s important to note that these proteins can also be elevated in the blood because of muscle damage. The reference range for AST is 10-40 U/L, and 7-56 U/Lfor ALT, but are these values optimal for health and longevity?
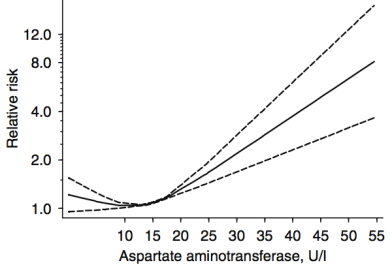
In a meta-analysis that included ~9 million adults (average age, 51y) that were followed for up to 20 years, Kunutsor et al. (2014) reported the association between AST and ALT with all-cause mortality risk. For AST (4 studies, 9,046,609 subjects), 10-15 U/L was associated with maximally reduced all-cause mortality risk:
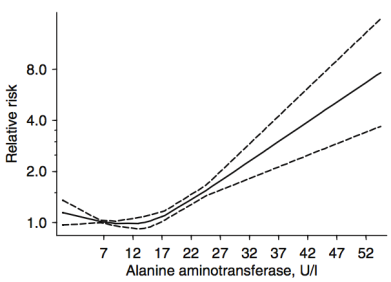
For ALT (8 studies, 9,087,436 subjects), 12-15 U/L was associated with maximally reduced all-cause mortality risk:
While these studies are relevant for middle-aged adults between ~50-70y, what about at older ages? Shown below are the AST and ALT values for adults older than 100 years (centenarians):
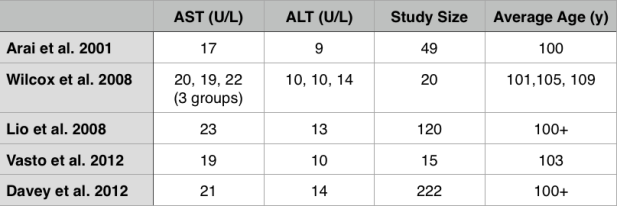
Interestingly, the centenarians’ AST and ALT values are not far from the meta-analysis data for middle-aged adults. For example, the centenarians’ AST values range from 17-23, and their ALT values from 9-14.
What are my my AST and ALT values? As shown below, I’ve measured them 9 times in the past 10 years. Based on the all-cause mortality and centenarian data my AST and ALT values are too high!

What am I doing to reduce my AST and ALT? Fructose is metabolized by the liver, where high amounts can increase liver cell damage, resulting in increased circulating AST and ALT (Le et al. 2009, Perez-Pozo et al. 2010). Therefore, I’ve reduced my total dietary fructose intake from ~16-18% during the 3 months prior to my last blood test (August, 2015), to ~11-14%. I plan on retesting within the next 2 months, to see if this approach works!
3/23/2016 Update: My average daily fructose intake, expressed as a percentage of total calories, for the 3-month period before my August 2015 blood test was 15.9%. During the 3-month period before my latest blood test (3/2016), my average daily fructose intake was 12.9%. Although a 3% decrease doesn’t seem like much, the difference between these 2 values is highly statistically significant (p value = 7.5E-12). Nonetheless, my liver enzymes didn’t change, with AST and ALT values of 28 and 30, respectively.
My next attempt to reduce my liver enzymes involves reducing my daily green tea intake. High doses of green tea have been shown to negatively affect the liver (Mazzanti et al. 2009). I currently drink ~6 cups of green tea per day, which may be too much. To test that hypothesis, I’ll reduce my daily green tea to 4 cups/day, and retest my liver enzymes in a few months.
12/8/2017 Update: Since 3/2016, I’ve tested my blood 7 times, and on each measurement, my ALT and AST were both still in the mid 30’s (or higher!). The green tea reduction experiment didn’t work, nor did ~30g of milk thistle seeds/day for 30+ days, nor did reducing my fructose intake to ~9% of total calories. Because I’ve tracked my nutrition in concordance with blood testing, I can look at which nutrients correlate with my liver enzymes, and reduce/increase certain foods that may impact them. Interestingly, my dietary niacin levels (x-axis), which average 41 mg/day (including all data since 2015) were strongly correlated with ALT (y-axis; r = 0.7, R^2=0.50):
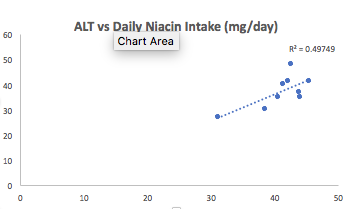
Note that the RDA for niacin is ~15 mg/day for males, and my average niacin intake in more than 2-fold higher than that! This may be a case where higher than the RDA is not optimal for health. Niacin in high doses, albeit in grams, not milligrams, is well known to induce liver damage, so isn’t it possible that my 2-fold higher than the RDA niacin intake is inducing liver damage? Sometime in January, I’ll retest my liver enzymes (and everything else, of course) while reducing my dietary niacin intake from the low 40’s to the low 30’s. As I’ve mentioned in previous posts, I eat lots of mushrooms, around 300 grams at a time, which supply around 11 mg of niacin. That’s atop the list to reduce my niacin intake. Stay tuned for the data!
1/6/2018 Update: Finally, progress! On my 1/3/2018 blood test, I was able to reduce my ALT from my average 37 U/L (over 9 different tests) value to 29! To reduce it, I tried two main things: reducing my dietary niacin intake, and increasing my selenium intake.
First, as noted above, the moderately strong correlation between my dietary niacin intake with ALT suggested that reducing it may also reduce my ALT. From 12/6/2017 to 1/2/2018, I reduced my average daily niacin intake from 41 mg/day to 33.1 mg. Interestingly, in adding that data to my 9 other blood test measurements over the last 27 months, the correlation between my niacin intake with my ALT remained strong (r = 0.75, R^2 = 0.58).
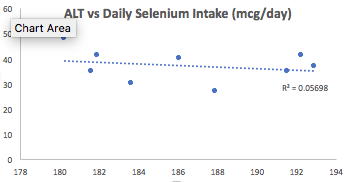
Second, I also increased my dietary selenium intake, which may be involved in affecting my ALT levels. Superficially, when examining the correlation between my average selenium intake (186 mcg/day; x-axis) with ALT (y-axis), we see a very weak negative correlation (r = -0.24, R^2 = 0.06):
Then why did I increase my daily selenium intake from an average value of 186 mg/day to 207 mg/day for the 1-month period that preceded my latest blood test? I discovered that the correlation between dietary selenium density (selenium intake/100 calories) with ALT was strong (r = -0.69, R^2 = 0.47):
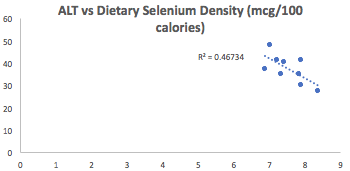
Why did I look at dietary selenium density instead of its absolute value? If I eat more calories, one would expect higher levels of selenium (or other nutrients), assuming I’m not eating junk. By accounting for my calorie intake, I may be better able to see how dietary nutrients affect my circulating biochemistry, rather that only looking at the absolute values for each nutrient. Also note that the correlation between niacin density (mg niacin/100 calories) was not as strong (r = 0.53, R^2 = 0.28) as the correlation between selenium density with ALT.
Is my ALT sensitive to changes in niacin, selenium, or both? Alternatively, maybe it wasn’t niacin or selenium, but an aberrant reading? I’ll keep my niacin relatively low, and my selenium relatively high, so let’s see on my next test at the end of the month.
If you’re interested, please have a look at my book!
References
Arai Y, Takayama M, Gondo Y, Inagaki H, Yamamura K, Nakazawa S, Kojima T, Ebihara Y, Shimizu K, Masui Y, Kitagawa K, Takebayashi T, Hirose N. Adipose endocrine function, insulin-like growth factor-1 axis, and exceptional survival beyond 100 years of age. J Gerontol A Biol Sci Med Sci. 2008 Nov;63(11):1209-18.
Davey A, Lele U, Elias MF, Dore GA, Siegler IC, Johnson MA, Hausman DB, Tenover JL, Poon LW; Georgia Centenarian Study. Diabetes mellitus in centenarians. J Am Geriatr Soc. 2012 Mar;60(3):468-73.
Kunutsor SK, Apekey TA, Seddoh D, Walley J. Liver enzymes and risk of all-cause mortality in general populations: a systematic review and meta-analysis. Int J Epidemiol. 2014 Feb;43(1):187-201.
Lê KA, Ith M, Kreis R, Faeh D, Bortolotti M, Tran C, Boesch C, Tappy L. Fructose overconsumption causes dyslipidemia and ectopic lipid deposition in healthy subjects with and without a family history of type 2 diabetes. Am J Clin Nutr. 2009 Jun;89(6):1760-5.
Lio D, Malaguarnera M, Maugeri D, Ferlito L, Bennati E, Scola L, Motta M, Caruso C. Laboratory parameters in centenarians of Italian ancestry. Exp Gerontol. 2008 Feb;43(2):119-22.
Mazzanti G, Menniti-Ippolito F, Moro PA, Cassetti F, Raschetti R, Santuccio C, Mastrangelo S. Hepatotoxicity from green tea: a review of the literature and two unpublished cases. Eur J Clin Pharmacol. 2009 Apr;65(4):331-41.
Perez-Pozo SE, Schold J, Nakagawa T, Sánchez-Lozada LG, Johnson RJ, Lillo JL. Excessive fructose intake induces the features of metabolic syndrome in healthy adult men: role of uric acid in the hypertensive response. Int J Obes (Lond). 2010 Mar;34(3):454-61.
Willcox DC, Willcox BJ, Wang NC, He Q, Rosenbaum M, Suzuki M. Life at the extreme limit: phenotypic characteristics of supercentenarians in Okinawa. J Gerontol A Biol Sci Med Sci. 2008 Nov;63(11):1201-8.
Vasto S, Scapagnini G, Rizzo C, Monastero R, Marchese A, Caruso C. Mediterranean diet and longevity in Sicily: survey in a Sicani Mountains population. Rejuvenation Res. 2012 Apr;15(2):184-8.
My approach towards optimal health involves yearly blood testing and tracking my results to catch changes before they become problematic. In this article, I will evaluate the published literature to propose an optimal range for circulating white blood cells (WBC).
Why is measuring WBCs important? Briefly, circulating WBCs are correlated with inflammation- inflammation increases during aging, is associated with decreased function of multiple organ systems, and is associated with an increased chronic disease risk (Cevenini et al. 2013).
As shown below, Huang et al. (2007) reported significant correlations between circulating WBCs with a marker of inflammation, C-reactive protein (CRP). This correlation was statistically significant in the whole population (14,114 subjects), in subjects older than or less than 50 years, and separately in men and women.

Based on that data, Huang et al. (2007) suggested changing the reference range (8 years ago!) for WBCs from 4-11 to 3.11-8.83 K/mm3. But within that range, what’s optimal for health and longevity? Because WBC are elevated in association with inflammation, the hypothesis would be that the lower end of the range is better, with values ~4 being optimal. Is this true?
Several studies have reported that WBC values greater than 5 are associated with an increased all-cause mortality risk (Ahmadi-Abhari et al. 2013, Samet et al. 2005, Weijenberg et al. 1996). However, the best evidence for the association between WBCs with mortality risk comes from the Baltimore Longitudinal Study on Aging (BLSA), which studied 2803 men and women over a period of 44 years (Ruggiero et al. 2007). As shown below, subjects that had circulating WBC between 3.5 and 6 had decreased mortality risk, whereas below 3.5, between 6-10, and 10+ each had successively higher risk. The 0.5 point on the y-axis of the curve (survival) is defined as 50% mortality, where half of the study subjects have died. At that point, compared with subjects with WBC values between 6-10, people with values between 3.5 and 6 live ~7 years longer! So getting your WBC into that range may be a big deal for living significantly longer.

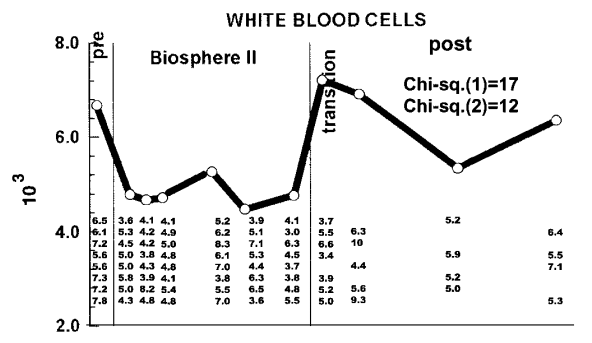
How can you reduce circulating WBCs? One way to reduce WBCs is to eat less calories, thereby reducing your body weight. As shown below, eating less calories resulted in decreased BMI and decreased WBCs in the Biosphere II project (Walford et al. 2002), almost exactly in the same pattern:

Because calorie restriction reduced WBCs from ~6.8 to 4.6, should 4.6 be considered optimal? In support of this idea, calorie restriction is well documented to increase lifespan in a variety of organisms, including flies, worms, and rodents. Although there isn’t any evidence on the long-term effects of calorie restriction (CR) on lifespan in people, it has been shown to be protective against age-related diseases, including abdominal obesity, diabetes, hypertension, and cardiovascular disease (Omodei and Fontana 2011). Therefore, a reduced WBC level may be related to the positive health-related effects of CR.
As an argument against using the CR-mediated reduction in WBC as a guide for what the optimal range should be, calorically restricted mice have decreased infection-related survival (Goldberg et al. 2015):

However, it’s important to note that infection-related survival was decreased in adult CR mice that were 40% restricted in terms of daily calories. Based on the Biosphere 2 data above, BMI was reduced from ~23 to 19, which translates into an ~18% reduction in BMI. However, whether 18% CR is better for improving infection-related survival compared with 40% CR is currently unknown.
What’s my WBC level? My lowest WBC value was in 2008, at 3.9. In 4 measurements from 2008-2013 my WBC increased to 4.4, 4.6, 5.7, and 5.9. However, in my most recent blood test, they’re back down to 4.4. I have 2 possible explanations for reducing my age-related increase in WBCs. First, my body weight weight is ~10 lbs less since last year, and my 100g+ fiber diet may improve gut barrier function to keep bacteria and other stuff out of my blood that shouldn’t be there, thereby decreasing my systemic immune response.

My recent 4.4 WBC value puts me close to the CR-value (4.6), and within the optimal 3.5-6 range identified in the BLSA study. So far so good! Stay tuned for the data next year to see if my WBCs remain low or start to rise again.
If you’re interested, please have a look at my book!
References
Ahmadi-Abhari S, Luben RN, Wareham NJ, Khaw KT. Seventeen year risk of all-cause and cause-specific mortality associated with C-reactive protein, fibrinogen and leukocyte count in men and women: the EPIC-Norfolk study. Eur J Epidemiol. 2013 Jul;28(7):541-50.
Cevenini E, Caruso C, Candore G, Capri M, Nuzzo D, Duro G, Rizzo C, Colonna-Romano G, Lio D, Di Carlo D, Palmas MG, Scurti M, Pini E, Franceschi C, Vasto S. Age-related inflammation: the contribution of different organs, tissues and systems. How to face it for therapeutic approaches. Curr Pharm Des. 2010;16(6):609-18.
Goldberg EL, Romero-Aleshire MJ, Renkema KR, Ventevogel MS, Chew WM, Uhrlaub JL, Smithey MJ, Limesand KH, Sempowski GD, Brooks HL, Nikolich-Žugich J. Lifespan-extending caloric restriction or mTOR inhibition impair adaptive immunity of old mice by distinct mechanisms. Aging Cell. 2015 Feb;14(1):130-8.
Huang ZS, Lo SC, Tsay W, Hsu KL, Chiang FT. Revision in referene ranges of peripheral total leukocyte count and differential leukocyte percentages based on a normal serum C-reactive protein level. J Formos Med Assoc. 2007 Aug;106(8):608-16.
Jee SH, Park JY, Kim HS, Lee TY, Samet JM. White blood cell count and risk for all-cause, cardiovascular, and cancer mortality in a cohort of Koreans. Am J Epidemiol. 2005 Dec 1;162(11):1062-9.
Omodei D, Fontana L. Calorie restriction and prevention of age-associated chronic disease. FEBS Lett. 2011 Jun 6;585(11):1537-42.
Ruggiero C, Metter EJ, Cherubini A, Maggio M, Sen R, Najjar SS, Windham GB, Ble A, Senin U, Ferrucci L. White blood cell count and mortality in the Baltimore Longitudinal Study of Aging. J Am Coll Cardiol. 2007 May 8;49(18):1841-50.
Walford RL, Mock D, Verdery R, MacCallum T. Calorie restriction in biosphere 2: alterations in physiologic, hematologic, hormonal, and biochemical parameters in humans restricted for a 2-year period. J Gerontol A Biol Sci Med Sci. 2002 Jun;57(6):B211-24.
Weijenberg MP, Feskens EJ, Kromhout D. White blood cell count and the risk of coronary heart disease and all-cause mortality in elderly men. Arterioscler Thromb Vasc Biol. 1996 Apr;16(4):499-503.
