Tag Archives: mortality

Resting Heart Rate, Heart Rate Variability: January 2020 Update

How’s my progress on the road to achieving a resting heart rate (RHR) as close to 40 beats per minute (bpm) as possible? Shown below is my RHR data for August 2018-Jan 2019, which corresponds to the 6-month period after I started tracking RHR. When compared with that period, am I still making year-over-year progress?

jan hr

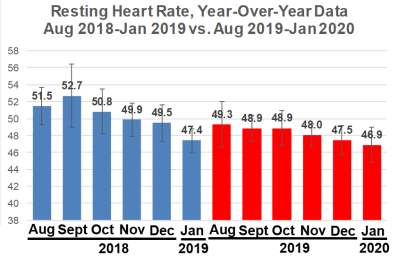
First, note that my Jan 2019 RHR value of 47.4 bpm seems dramatically reduced when compared with Aug-Dec 2018. My computer crashed in Jan 2019, and I lost 4 days of January 2019 RHR data, with remaining data for 27 days. Accordingly, I didn’t expect to be better than that, year-over-year. Nonetheless,  my average RHR for Jan 2020 is 46.9 bpm, which is superficially better, but it isn’t statistically different from Jan 2019 (p = 0.13). However, my RHR is still going in the right direction!

What about my heart rate variability (HRV)? Relative to Jan 2019 (56.6), my HRV in Jan 2020 was significantly higher (76; p=0.003), but note that I didn’t additionally improve my HRV relative to December 2019 (86.3).

hrvjan2

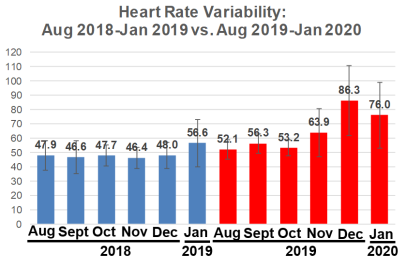
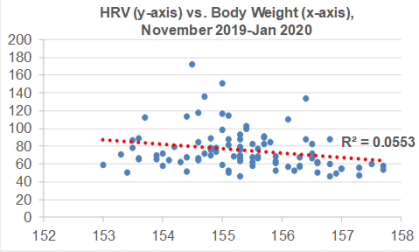
I’ve been consistent with my exercise program, including weekly workouts (3-4x, ~1 hr each session) and walking (15-20 miles), so are there other variables that may explain the sudden increase in HRV from Nov 2019-Jan 2020? During that time, I’ve been cutting my calorie intake by a small amount (~100-200 cals/day) below my body weight maintenance intake, with the goal of getting leaner. As a result, I’ve slowly decreased my body weight from 157 to 154 during that time. Although there is a weak negative correlation between my body weight with HRV (R2=0.0553), this association is statistically significant (p=0.024). So reducing body weight may have played a role in the sudden HRV increase:

hrv bw

For those who may have missed my other post updates for RHR and/or HRV:
Dec 2019 update: https://michaellustgarten.wordpress.com/2020/01/01/resting-heart-rate-heart-rate-variability-december-2019-update/

Oct, Nov 2019 update: https://michaellustgarten.wordpress.com/2019/12/05/resting-heart-rate-heart-rate-variability-still-making-progress/

Sept 2019 update: https://michaellustgarten.wordpress.com/2019/10/08/resting-heart-rate-year-over-year-update/

Also, why a RHR as close to 40 bpm may be optimal: https://michaellustgarten.wordpress.com/2019/02/02/resting-heart-rate-whats-optimal/


If you’re interested, please have a look at my book!


High-Fiber Diets Are Associated With Reduced All-Cause Mortality Risk

A meta-analysis of 10 studies, including 80,139 subjects was recently published that shows a significantly reduced risk of death for all causes in association with higher total dietary fiber intakes (35-39g/day), when compared with lower fiber (Reynolds et al. 2019):

Screen Shot 2020-01-26 at 12.15.51 PM


Should we supplement with fiber, or get it from whole food? Fiber from whole foods was significantly associated with lower levels of fasting glucose, body weight, whole body fat mass, LDL cholesterol, and triglycerides. Supplementation with fiber extracts or bran was not significantly associated with the reduction of any of these variables (NS, not significant; NM, not measured:

fiber


Reference

Reynolds A, Mann J, Cummings J, Winter N, Mete E, Te Morenga L. Carbohydrate quality and human health: a series of systematic reviews and meta-analyses. Lancet. 2019 Feb 2;393(10170):434-445. doi: 10.1016/S0140-6736(18)31809-9.


If you’re interested, please have a look a my book!

Epigenetic Aging: Can It Be Slowed With Diet?

Having a faster rate of epigenetic aging, as measured by the epigenetic age metric, AgeAccelGrim, is associated with a significantly increased risk of death for all causes in a variety of cohorts, including the Framingham Heart Study (FHS), the Women’s Health Initiative (WHI) study, the InChianti study, the Jackson Heart Study (JHS), and collectively, when evaluated as a meta-analysis (Lu et al. 2019):

Screen Shot 2019-12-07 at 2.23.27 PM.png

With the goal of minimizing disease risk and maximizing longevity, can epigenetic aging be slowed? Shown below is the correlation between dietary components with AgeAccelGrim. Dietary factors that were significantly associated  (the column labelled, “p”) with a younger epigenetic age were carbohydrate intake, dairy, whole grains, fruit, and vegetables. In contrast, dietary fat intake and red meat were associated with older epigenetic ages (Lu et al. 2019):

Screen Shot 2019-12-07 at 2.34.50 PM.png

Note that dietary recall data as a means for identifying nutrient intake can be unreliable-a better measure of dietary intake is circulating biomarkers. Are there associations between circulating biomarkers of nutrient intake with epigenetic aging?

Higher blood levels of carotenoids, including lycopene, alpha- and beta-carotene, lutein+zeaxanthin, and beta-cryptoxanthin were associated with a younger epigenetic age (Lu et al. 2019):

epi veg

If your goal is optimal health and longevity, eating foods that are rich in these nutrients may be an important strategy for slowing epigenetic aging. Which foods contain these nutrients? Carotenoids are found almost exclusively in vegetables and fruits. For example, lycopene is enriched in watermelon and tomatoes, alpha- and beta-carotene is high in carrots, orange vegetables (sweet potato, squash, pumpkin) and greens, lutein+zeaxanthin is prevalent in greens, and beta-cryptoxanthin’s highest levels are found in butternut squash and red bell peppers.

If you’re interested, please have a look at my book!

References

Nutrient composition data: https://reedir.arsnet.usda.gov/codesearchwebapp/(S(ujsr52ygvp0tw13m1luk0rny))/CodeSearch.aspx

Lu AT, Quach A, Wilson JG, Reiner AP, Aviv A, Raj K, Hou L, Baccarelli AA, Li Y, Stewart JD, Whitsel EA, Assimes TL, Ferrucci L, Horvath S. DNA methylation GrimAge strongly predicts lifespan and healthspan. Aging (Albany NY). 2019 Jan 21;11(2):303-327. doi: 10.18632/aging.101684.

Optimizing Biological Age With Aging.ai: Platelets

Platelets are one of the 19 variables that are included in the biological age calculator, aging.ai.  The reference range is 150-400 platelets per nanoliter (*10^9/L), but within that range, what’s optimal?

In a study of 21,635 adults older than 35y (average age wasn’t reported), platelets between 230-270 were associated with a maximally reduced risk of death from all causes (Bonaccio et al. 2016):

platets acm

Similarly, in a study of 21,252 adults (average age 53y), values ~250 were associated with maximally reduced risk of death from all causes Vinholt et al. (2017) :

plat2 acm

What about in older adults? In a study of 159,746 postmenopausal women (average age, 63y), maximally reduced risk of death from all causes was associated with platelet values between 200-256 (Kabat et al. 2017).

In a smaller study (36,262 older adults, average age, 71y), platelet values ~250 were associated with maximally reduced risk for all-cause mortality. Interestingly, even at platelet values ~250, mortality risk was highest for non-Hispanic whites, when compared with lower mortality risk for non-Hispanic blacks and Hispanics (Msaouel et al. 2014):

plat ethnicity

In 5,766 older adults (average age, 73y), platelets higher than 200-300 was associated with an increased risk of death from all causes (van der Bom et al 2009). Risk for values between 100-199 was not different when compared against 200-299, but there was a non-significant trend towards increased risk (1.05, 95% CI: 0.97, 1.14).

In 131,308 older adults (~73y), maximally reduced risk of death from all causes was associated with platelet values between 200-300, whereas risk significantly increased below and above that range, respectively Tsai et al. (2015):

plat eld

In sum, the data suggests that platelet values ~250 may be optimal for heath, with 200-300 as the “optimal range” within the 150-400 reference range. What are my values? Over the past 16 years, I’ve measured my platelets 25 times, and 6x, my platelets were below this 200-300 range. I’m not too worried about it, though, as most of my measurements are within that range!

plt.png

Are there any variables that are correlated with platelets? For me, the strongest correlation over 18 tracked blood tests from 2015 – 2019 is my body weight. As my weight increases, my platelets are higher (r = 0.64, p-value = 0.006)Platelets have been reported to increase in association with elevated inflammation (CRP; Izzi et al. 2018), but I only have 3 co-measurements for CRP with platelets. I have a blood test scheduled for next week, more data coming soon!


If you’re interested, please have a look at my book!


References

Bonaccio M, Di Castelnuovo A, Costanzo S, De Curtis A, Donati MB, Cerletti C, de Gaetano G, Iacoviello L; MOLI-SANI Investigators. Age-sex-specific ranges of platelet count and all-cause mortality: prospective findings from the MOLI-SANI study. Blood. 2016 Mar 24;127(12):1614-6.

Izzi B, Bonaccio M, de Gaetano G, Cerletti C. Learning by counting blood platelets in population studiessurvey and perspective a long way after BizzozeroJ Thromb Haemost. 2018 Sep;16(9):1711-1721. doi: 10.1111/jth.14202.

Kabat GC, Kim MY, Verma AK, Manson JE, Lin J, Lessin L, Wassertheil-Smoller S, Rohan TE. Platelet count and total and cause-specific mortality in the Women’s Health InitiativeAnn Epidemiol. 2017 Apr;27(4):274-280.

Msaouel P, Lam AP, Gundabolu K, Chrysofakis G, Yu Y, Mantzaris I, Friedman E, Verma A. Abnormal platelet count is an independent predictor of mortality in the elderly and is influenced by ethnicityHaematologica. 2014 May;99(5):930-6.

Tsai MT, Chen YT, Lin CH, Huang TP, Tarng DC; Taiwan Geriatric Kidney Disease Research Group. U-shaped mortality curve associated with platelet count among older people: a community-based cohort study. Blood. 2015 Sep 24;126(13):1633-5.

Vinholt PJ, Hvas AM, Frederiksen H, Bathum L, Jørgensen MK, Nybo M. Thromb Res.Platelet count is associated with cardiovascular disease, cancer and mortality: A population-based cohort study. 2016 Dec;148:136-142.

Circulating Biomarkers Associated With Coronary Artery Calcification

The coronary artery calcification (CAC) score is a measure of how much calcification is in the coronary arteries, and accordingly, is an in vivo measure of atherosclerosis. Why is the CAC score important? Besides its role in atherosclerosis, risk of death for all causes goes up at any age as the CAC score increases. For ex., in people younger than 50 (left side below), as the CAC score increases from 0 to 1-399, 400-999, and > 1000, risk of death for all causes increases by ~10-fold, from 2.3 per 1000 person years (PY) to 6.1/1000, 9.7/1000, and 22.7/1000. Similarly, for people older than 70y (right side below), as the CAC score increases, baseline all-cause mortality risk increases ~15-fold, from 5.6/1000 to 21.6/1000, 44.3/1000, and 76/1000, respectively (Hartaigh et al. 2016):

Screen Shot 2019-10-20 at 8.40.05 AM.png

Are blood biomarkers associated with CAC? When the CAC score was elevated, a greater percentage of white blood cells (WBCs) that were neutrophils and the red blood cell distribution width (RDW%) were higher, whereas lower CAC scores were associated with higher levels for the fraction of lymphocytes divided by total WBCs and higher total red blood cells (den Harder et al. 2018):

n l rdw cac

In agreement with these data, CAC scores > 100 were associated with a higher RDW% (13.0%) and a higher neutrophil/lymphocyte ratio (NLR; 1.54), when compared with CAC < 100 (RDW = 12.8%; NLR = 1.39; Gürel et al. 2019).

The findings that a higher RDW% and higher levels of neutrophils, but lower levels of lymphocytes are associated with a higher CAC score is in agreement with the data for how these variables change with aging and their associations with all-cause mortality risk. First, note that I previously reported that RDW% increases during aging and is associated with an increased risk of death from all causes (https://michaellustgarten.wordpress.com/2019/09/25/optimizing-biological-age-rdw/). Similarly, neutrophils increase, whereas lymphocytes decrease, thereby leading to a higher neutrophil/lymphocyte ratio during aging, which is associated with an increased all-cause mortality risk (https://michaellustgarten.wordpress.com/2019/10/10/neutrophil-lymphocyte-ratio-and-survival/).

If you’re interested, please have a look at my book!

References

den Harder AM, de Jong PA, de Groot MCH, Wolterink JM, Budde RPJ, Iŝgum I, van Solinge WW, Ten Berg MJ, Lutgens E, Veldhuis WB, Haitjema S, Hoefer IE, Leiner T. Commonly available hematological biomarkers are associated with the extent of coronary calcifications. Atherosclerosis. 2018 Aug;275:166-173. doi: 10.1016/j.atherosclerosis.2018.06.017.

Gürel OM, Demircelik MB, Bilgic MA, Yilmaz H, Yilmaz OC, Cakmak M, Eryonucu B. Association between Red Blood Cell Distribution Width and Coronary Artery Calcification in Patients Undergoing 64-Multidetector Computed TomographyKorean Circ J. 2015 Sep;45(5):372-7. doi: 10.4070/kcj.2015.45.5.372.

Hartaigh BÓ, Valenti V, Cho I, Schulman-Marcus J, Gransar H, Knapper J, Kelkar AA, Xie JX, Chang HJ, Shaw LJ, Callister TQ, Min JK. 15-Year prognostic utility of coronary artery calcium scoring for all-cause mortality in the elderly. Atherosclerosis. 2016 Mar;246:361-6. doi: 10.1016/j.atherosclerosis.2016.01.039.

Sarcopenia, Disease Risk, And The Neutrophil/Lymphocyte Ratio

In an earlier post, based on data from the Baltimore Longitidunal Study on Aging (BLSA), I suggested that total white blood cell (WBCs) counts between 3500 to 6000 cells per microliter of blood may be optimal for reducing disease risk and for maximizing longevity (https://michaellustgarten.wordpress.com/2015/08/13/blood-testing-whats-optimal-for-wbc-levels/).

However, within WBCs, neutrophils increase, whereas lymphocytes decrease during aging (Ruggiero et al. 2007, Starr and Dreary 2011). As a result, the ratio between neutrophils with lymphocytes (NLR) increases during aging from ~1.5 in 20 year olds to ~1.8 in adults older than 75y (Li et al. 2015):

Screen Shot 2019-10-06 at 3.40.06 PM

An increased neutrophil/lymphocyte ratio during aging may be bad for health and disease risk. First, a higher neutrophil/lymphocyte ratio is associated with sarcopenia (defined as the age-related loss of muscle mass and physical function) in older adults (average age, 72y; Öztürk et al. 2018):

Screen Shot 2019-09-13 at 7.46.06 AM

Second, risk of death for all causes is significantly increased for older adults (average age, 66y) that had higher NLR values (60-80%, >80%, equivalent to NLR = 1.92-2.41, > 2.41), when compared with lower NLR values (< 20%, 20-40%, 40-60%, equivalent to NLR < 1.90; Fest et al. 2019):

nlr

Similarly, all-cause mortality risk was 30% increased in older adults (average age, 54y) that had NLR values > 1.77, when compared with < 1.77, and 40% increased for NLR values > 2.15, when compared with < 2.15 (Kime et al. 2018).

What are my NLR values? Over 17 blood test measurements from 2015 – 2019, my average NLR is 1.11. So far so good!

nlr


If you’re interested, please have a look at my book!


References

Fest J, Ruiter TR, Groot Koerkamp B, Rizopoulos D, Ikram MA, van Eijck CHJ, Stricker BH. The neutrophil-to-lymphocyte ratio is associated with mortality in the general population: The Rotterdam Study. Eur J Epidemiol. 2019 May;34(5):463-470.

Kim S, Eliot M, Koestler DC, Wu WC, Kelsey KT. Association of Neutrophil-to-Lymphocyte Ratio With Mortality and Cardiovascular Disease in the Jackson Heart Study and Modification by the Duffy Antigen Variant. JAMA Cardiol. 2018 Jun 1;3(6):455-462. doi: 10.1001/jamacardio.2018.1042.

Li J, Chen Q, Luo X, Hong J, Pan K, Lin X, Liu X, Zhou L, Wang H, Xu Y, Li H, Duan C. Neutrophil-to-Lymphocyte Ratio Positively Correlates to Age in Healthy PopulationJ Clin Lab Anal. 2015 Nov;29(6):437-43. doi: 10.1002/jcla.21791.

Öztürk ZA, Kul S, Türkbeyler İH, Sayıner ZA, Abiyev A. Is increased neutrophil lymphocyte ratio remarking the inflammation in sarcopenia? Exp Gerontol. 2018 Sep;110:223-229.

Ruggiero C, Metter EJ, Cherubini A, Maggio M, Sen R, Najjar SS, Windham GB, Ble A, Senin U, Ferrucci L. White blood cell count and mortality in the Baltimore Longitudinal Study of AgingJ Am Coll Cardiol. 2007 May 8;49(18):1841-50.

Starr JM, Deary IJ. Sex differences in blood cell counts in the Lothian Birth Cohort 1921 between 79 and 87 years. Maturitas. 2011 Aug;69(4):373-6.

Blood glucose: What’s optimal?

The reference range for circulating levels of glucose is 70-130 mg/dL. That’s a wide range, so what’s optimal, especially considering that glucose is one of the variables used to quantify of biological age (https://michaellustgarten.wordpress.com/2019/09/09/quantifying-biological-age)?

In the largest study published for this subject (12,455,361 adults), risk of death for all causes was maximally reduced for glucose levels between 80-94 mg/dL (Yi et al. 2017). In contrast, mortality risk significantly increased when glucose levels were < 80 or > 100 mg/dL in both men and women:
bg

As glucose levels rise above 100 mg/dL, risk for Type II diabetes increases, which is one potential explanation for higher glucose levels being associated with a higher mortality risk. Why would glucose levels lower than 80 mg/dL also be associated with worse health? Interestingly, glucose levels < 80 mg/dL are associated with an increased risk of death from “total external causes” (left panel below), including unintentional accidents and transport accidents (middle, right panel below) in a relatively large study of 345,318 adults (Yi et al. 2019). In addition, an increased mortality risk from transport accidents involving pedestrians or cyclists was associated with glucose levels below 55 mg/dL (data not shown):

Screen Shot 2019-10-02 at 6.33.07 AM

Glucose levels increase during aging (Yi et al. 2017), evidence that adds further merit that lower is better (but not below 80 mg/dL!):

Screen Shot 2019-10-02 at 6.47.39 AM.png

What are my glucose levels? Shown below is my data for the past 13 years:

my bg

On the left side of the chart, I measured my glucose levels about once per year from 33-40y, resulting in an average value of 89 mg/dL. Since 2015 I started daily dietary tracking, and tested more often (19x), resulting in an average value of 87 mg/dL. The comparison between these 2 groups of data is not significantly different (p=0.19). Based on the data in Yi et al., my glucose levels should have increased from 92 to 96 mg/dL during the past 13 years. Instead, my glucose levels during that period are relatively stable, with average value (87.5 mg/dL) that would be expected for a 26y old. So far, so good!

If you’re interested, please have a look at my book!


References

Yi SW, Park S, Lee YH, Park HJ, Balkau B, Yi JJ. Association between fasting glucose and all-cause mortality according to sex and age: a prospective cohort studySci Rep. 2017 Aug 15;7(1):8194. doi: 10.1038/s41598-017-08498-6.

Yi SW, Won YJ, Yi JJ. Low normal fasting glucose and risk of accidental death in Korean adults: A prospective cohort studyDiabetes Metab. 2019 Jan;45(1):60-66. doi: 10.1016/j.diabet.2018.01.005.

Ending Aging-Related Diseases 2019: Lustgarten Presentation

In the first half of this presentation, I talk about my contribution to the gut-muscle axis in older adults, and in the second half, my personalized approach to optimal health!

Also, here’s the article that corresponds to the presentation:
https://www.leafscience.org/the-gut-microbiome-affects-muscle-strength-in-older-adults/

If you’re interested, please have a look at my book!

Drink Green Tea, Reduce All-Cause Mortality Risk?

Is green tea consumption associated with reduced risk of death risk from all causes? To investigate this question, Tang et al. (2015) performed a meta-analysis of 5 studies, including 200,884 subjects. As shown below, drinking 2-3 cups (16-24 oz.) of green tea per day was associated with maximally decreased all-cause mortality risk, ~10%.

green tea

Post update (9/15/2019): Is there new data since this post was first published (2015) for the association between green tea with all-cause mortality risk? Two relatively large studies have been published since then. First, in a study of 164,681 men (average age, ~53y), consuming green tea (~15g/day) was associated with a maximally reduced risk of death from all causes (black lines; Liu et al. 2016). However, note that this data included both smokers and non-smokers. For non-smokers (green lines), all-cause mortality risk was maximally reduced even further at smaller doses, including ~ 6-10g of green tea/day:

Screen Shot 2019-09-15 at 9.15.09 AM

In support of these data, never-smoking men and women (average age, ~52y) that drank more than  8.2g, and 3.3g, respectively, of green tea had an 11% reduced risk of all-cause mortality in Zhao et al. (2017).

The data is clear, drink green tea!

If you’re interested, please have a look at my book!

Reference

Liu J, Liu S, Zhou H, Hanson T, Yang L, Chen Z, Zhou M. Association of green tea consumption with mortality from all-cause, cardiovascular disease and cancer in a Chinese cohort of 165,000 adult men. Eur J Epidemiol. 2016 Sep;31(9):853-65.

Tang J, Zheng JS, Fang L, Jin Y, Cai W, Li D. Tea consumption and mortality of all cancers, CVD and all causes: a meta-analysis of eighteen prospective cohort studies. Br J Nutr. 2015 Jul 23:1-11.

Zhao LG, Li HL, Sun JW, Yang Y, Ma X, Shu XO, Zheng W, Xiang YB. Green tea consumption and cause-specific mortalityResults from two prospective cohort studies in ChinaJ Epidemiol. 2017 Jan;27(1):36-41.

Quantifying Biological Age

In an earlier post, I wrote about quantifying my biological age with aging.ai (https://michaellustgarten.wordpress.com/2018/06/26/maximizing-health-and-lifespan-is-calorie-restriction-essential/). The importance of that post is illustrated by the finding that based on data from 13 blood tests between 2016 – 2019, my average biological age is 29.2y, which is ~33% younger than my chronological age.

On my quest for optimal health, I’m striving to get as accurate as possible when it comes to quantifying biological age. While the aging.ai biomarker set is strongly correlated with biologic age (r = 0.80), in 2018 two papers were published (Liu et al., Levine et al.) that introduced “Phenotypic Age”, which includes a combination of 9 circulating biomarkers + chronological age that is better at predicting biological age (r = 0.94) than aging.ai. It includes analytes that are found on the standard blood chemistry screen, including albumin, creatinine, glucose, lymphocyte %, mean corpuscular volume (MCV), red blood cell distribution width (RDW), alkaline phosphatase, white blood cells, and an analyte that is not found on that panel, C-reactive protein (CRP). In addition, chronological age is included as a covariate.

So what’s my biological age based on the Phenotypic Age calculator? When I input my data from my latest blood test measurement on 6/4/2019, I get a biological age of 35.39y, which is 23% lower than my chronological age of 46. Not bad!

phenoage

To quantify your biological age with the Phenotypic Age calculator, input your data in the Excel file that is embedded within the first paragraph of the following link:

DNAmPhenoAge_gen

3.27.25 Edit: In the link above, note that the denominator in D17 should be 0.090165, not 0.09165. Additionally, the units for albumin should be g/dL (not mg/dL), and lymphocyte isn’t spelled correctly. I can’t upload a new link-I’d have to upgrade my WordPress account to be able to upload files (which is ridiculous!).

If you’re interested, please have a look at my book!

References

Liu Z, Kuo PL, Horvath S, Crimmins E, Ferrucci L, Levine M. A new aging measure captures morbidity and mortality riskacross diverse subpopulations from NHANES IV: A cohort studyPLoS Med. 2018 Dec 31;15(12):e1002718. doi: 10.1371/journal.pmed.1002718.

Levine ME, Lu AT, Quach A, Chen BH, Assimes TL, Bandinelli S, Hou L, Baccarelli AA, Stewart JD, Li Y, Whitsel EA, Wilson JG, Reiner AP, Aviv A, Lohman K, Liu Y, Ferrucci L, Horvath S. An epigenetic biomarker of aging for lifespan and healthspanAging (Albany NY). 2018 Apr 18;10(4):573-591. doi: 10.18632/aging.101414.