While that value is 23% younger than my chronological age (46y), I knew that I could do better! So I tried again on September 17, 2019. Basically, the same biological age, 35.58y:
An 23% younger biological age on 2 separate dates, months apart might be good for most, but not for me. So, I tried again on October 29th, 2019, and voila, a biological age of 31.3y, which is 32% younger than my chronological age! How did I do it?
From my last blood test until my most recent blood test, I attempted a mild caloric restriction. To maintain my body weight, I require about 2800 calories per day, an amount which is based on daily body weight weighing in conjunction with daily dietary tracking. For the period of time that elapsed between my last 2 blood tests, I averaged 2657 calories/day, which is 3.2% less than the 2745 calories/day that I averaged for the dietary period that corresponded to my September blood test. That I was also in a very mild caloric restriction is confirmed by a reduction in my average body weight, which was (purposefully) down 0.7 lbs from September 17 to October 29th, when compared with the dietary period that corresponded to my September blood test (August 20 – September 17).
This is a superficial analysis of how I further reduced my biological age, but in future posts I’ll report the average dietary intake that corresponded to my relatively youthful biologic age!
If you’re interested, please have a look at my book!
Platelets are one of the 19 variables that are included in the biological age calculator, aging.ai. The reference range is 150-400 platelets per nanoliter (*10^9/L), but within that range, what’s optimal?
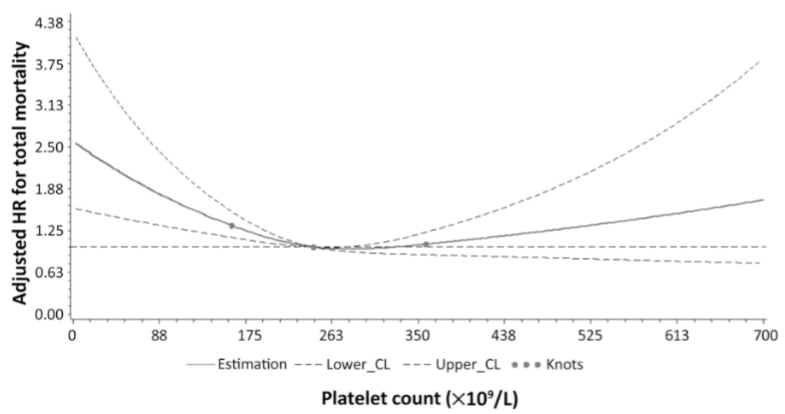
In a study of 21,635 adults older than 35y (average age wasn’t reported), platelets between 230-270 were associated with a maximally reduced risk of death from all causes (Bonaccio et al. 2016):
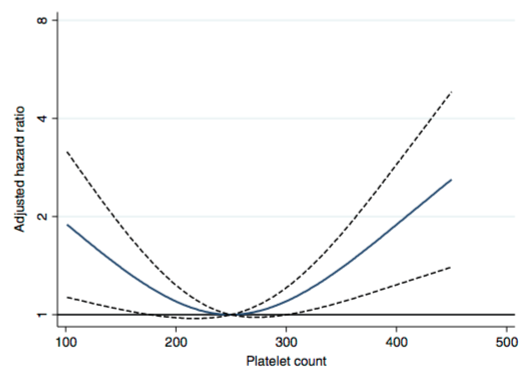
Similarly, in a study of 21,252 adults (average age 53y), values ~250 were associated with maximally reduced risk of death from all causes Vinholt et al. (2017) :
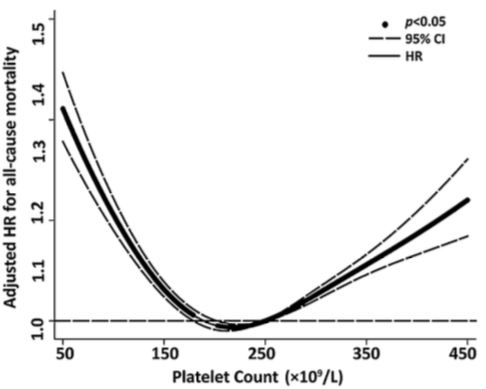
What about in older adults? In a study of 159,746 postmenopausal women (average age, 63y), maximally reduced risk of death from all causes was associated with platelet values between 200-256 (Kabat et al. 2017).
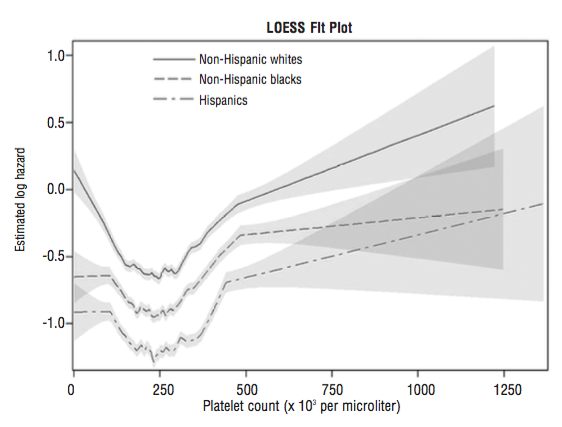
In a smaller study (36,262 older adults, average age, 71y), platelet values ~250 were associated with maximally reduced risk for all-cause mortality. Interestingly, even at platelet values ~250, mortality risk was highest for non-Hispanic whites, when compared with lower mortality risk for non-Hispanic blacks and Hispanics (Msaouel et al. 2014):
In 5,766 older adults (average age, 73y), platelets higher than 200-300 was associated with an increased risk of death from all causes (van der Bom et al 2009). Risk for values between 100-199 was not different when compared against 200-299, but there was a non-significant trend towards increased risk (1.05, 95% CI: 0.97, 1.14).
In 131,308 older adults (~73y), maximally reduced risk of death from all causes was associated with platelet values between 200-300, whereas risk significantly increased below and above that range, respectively Tsai et al. (2015):
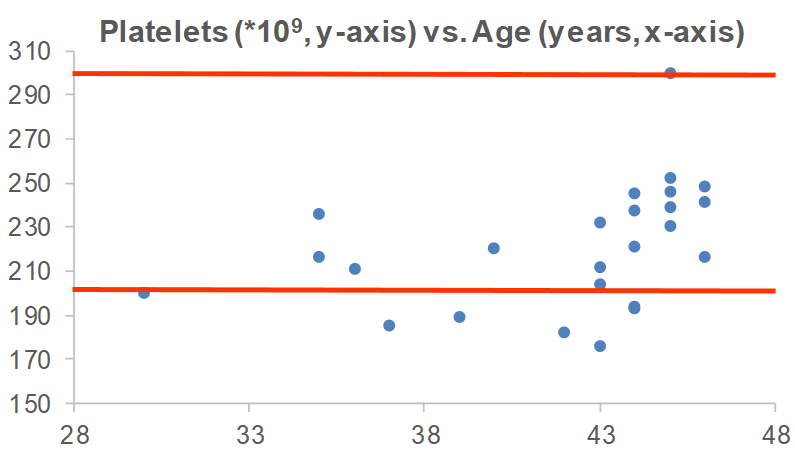
In sum, the data suggests that platelet values ~250 may be optimal for heath, with 200-300 as the “optimal range” within the 150-400 reference range. What are my values? Over the past 16 years, I’ve measured my platelets 25 times, and 6x, my platelets were below this 200-300 range. I’m not too worried about it, though, as most of my measurements are within that range!
Are there any variables that are correlated with platelets? For me, the strongest correlation over 18 tracked blood tests from 2015 – 2019 is my body weight. As my weight increases, my platelets are higher (r = 0.64, p-value = 0.006). Platelets have been reported to increase in association with elevated inflammation (CRP; Izzi et al. 2018), but I only have 3 co-measurements for CRP with platelets. I have a blood test scheduled for next week, more data coming soon!
If you’re interested, please have a look at my book!
References
Bonaccio M, Di Castelnuovo A, Costanzo S, De Curtis A, Donati MB, Cerletti C, de Gaetano G, Iacoviello L; MOLI-SANI Investigators. Age-sex-specific ranges of platelet count and all-cause mortality: prospective findings from the MOLI-SANI study. Blood. 2016 Mar 24;127(12):1614-6.
Izzi B, Bonaccio M, de Gaetano G, Cerletti C. Learning by countingbloodplatelets in populationstudies: survey and perspective a longwayafterBizzozero. J Thromb Haemost. 2018 Sep;16(9):1711-1721. doi: 10.1111/jth.14202.
Kabat GC, Kim MY, Verma AK, Manson JE, Lin J, Lessin L, Wassertheil-Smoller S, Rohan TE. Plateletcount and total and cause-specificmortality in the Women’s HealthInitiative. Ann Epidemiol. 2017 Apr;27(4):274-280.
Msaouel P, Lam AP, Gundabolu K, Chrysofakis G, Yu Y, Mantzaris I, Friedman E, Verma A. Abnormalplateletcount is an independentpredictor of mortality in the elderly and is influenced by ethnicity. Haematologica. 2014 May;99(5):930-6.
Tsai MT, Chen YT, Lin CH, Huang TP, Tarng DC; Taiwan Geriatric Kidney Disease Research Group. U-shaped mortality curve associated with platelet count among older people: a community-based cohort study. Blood. 2015 Sep 24;126(13):1633-5.
Vinholt PJ, Hvas AM, Frederiksen H, Bathum L, Jørgensen MK, Nybo M. Thromb Res.Plateletcount is associated with cardiovasculardisease, cancer and mortality: A population-basedcohortstudy. 2016 Dec;148:136-142.
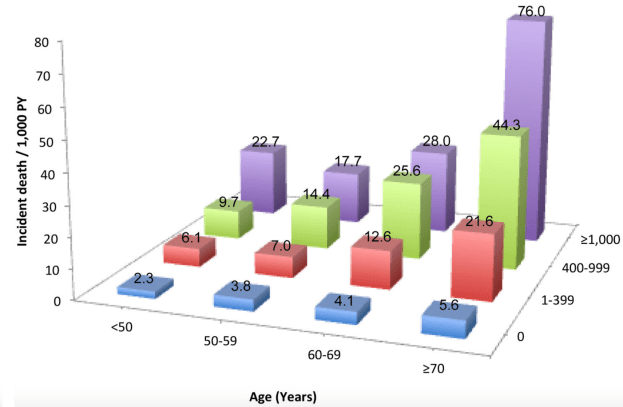
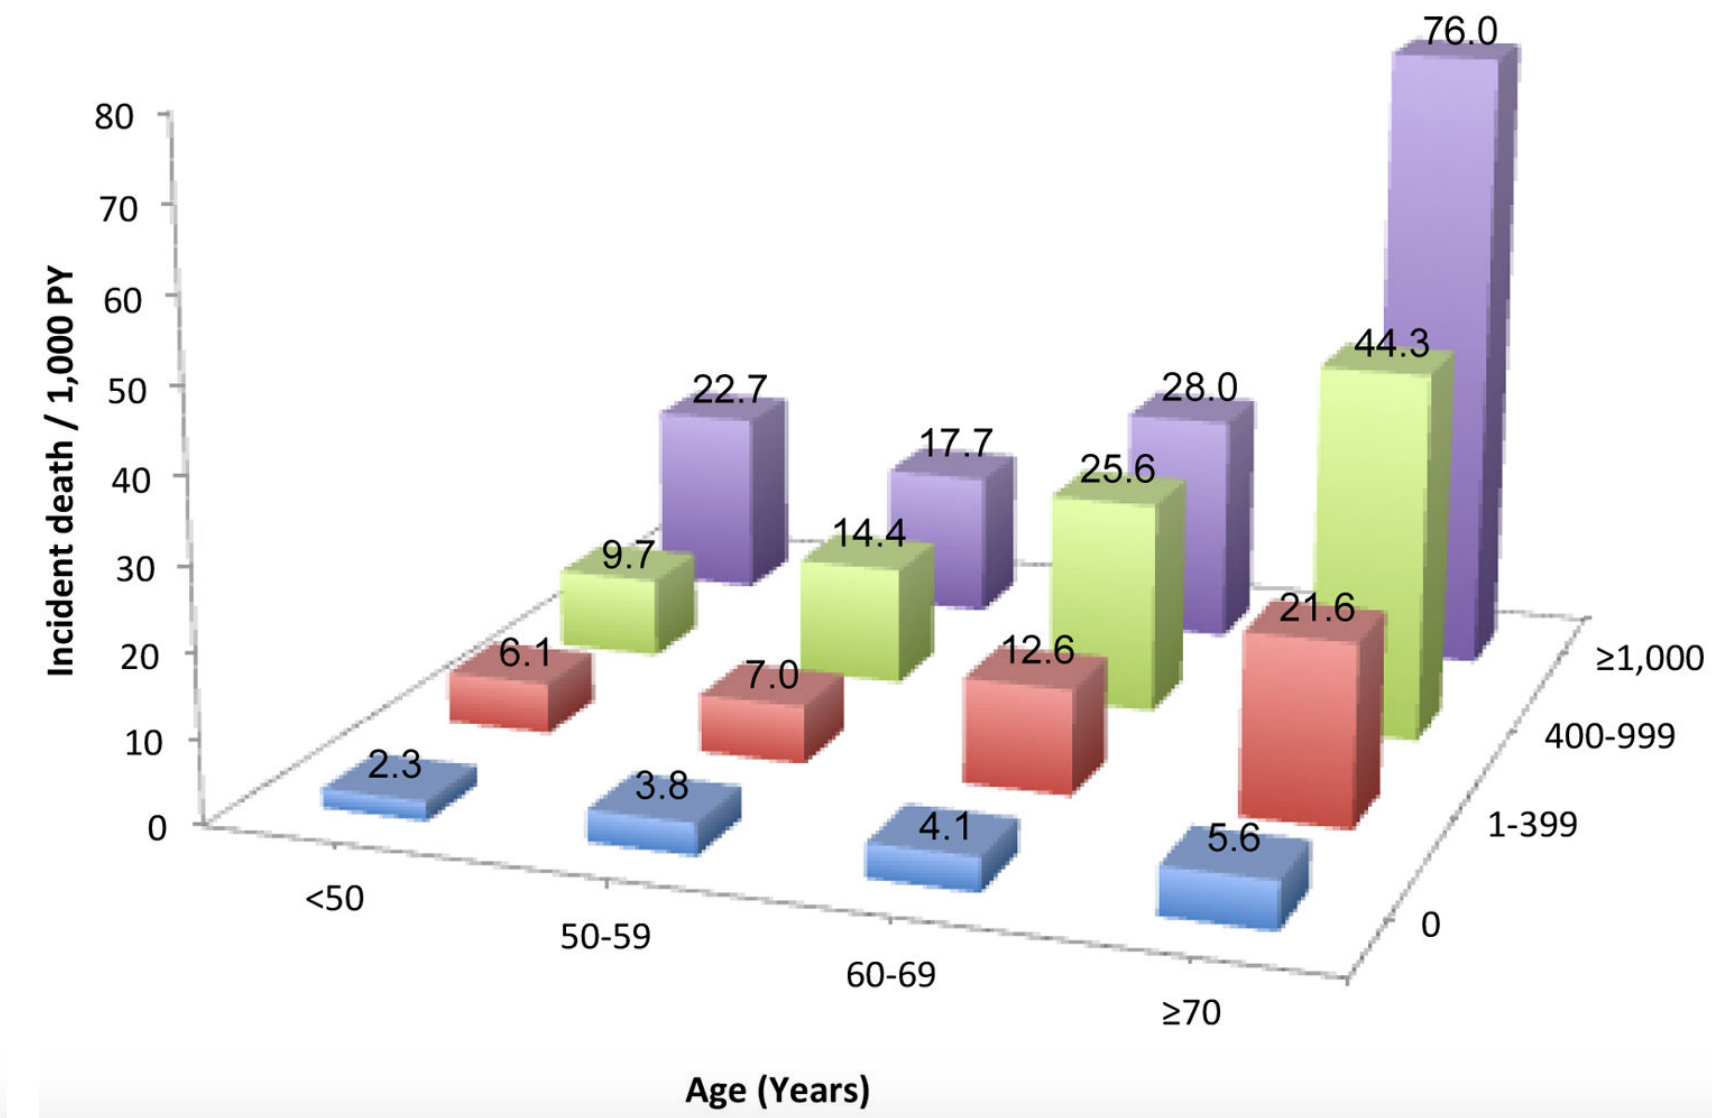
The coronary artery calcification (CAC) score is a measure of how much calcification is in the coronary arteries, and accordingly, is an in vivo measure of atherosclerosis. Why is the CAC score important? Besides its role in atherosclerosis, risk of death for all causes goes up at any age as the CAC score increases. For ex., in people younger than 50 (left side below), as the CAC score increases from 0 to 1-399, 400-999, and > 1000, risk of death for all causes increases by ~10-fold, from 2.3 per 1000 person years (PY) to 6.1/1000, 9.7/1000, and 22.7/1000. Similarly, for people older than 70y (right side below), as the CAC score increases, baseline all-cause mortality risk increases ~15-fold, from 5.6/1000 to 21.6/1000, 44.3/1000, and 76/1000, respectively (Hartaigh et al. 2016):
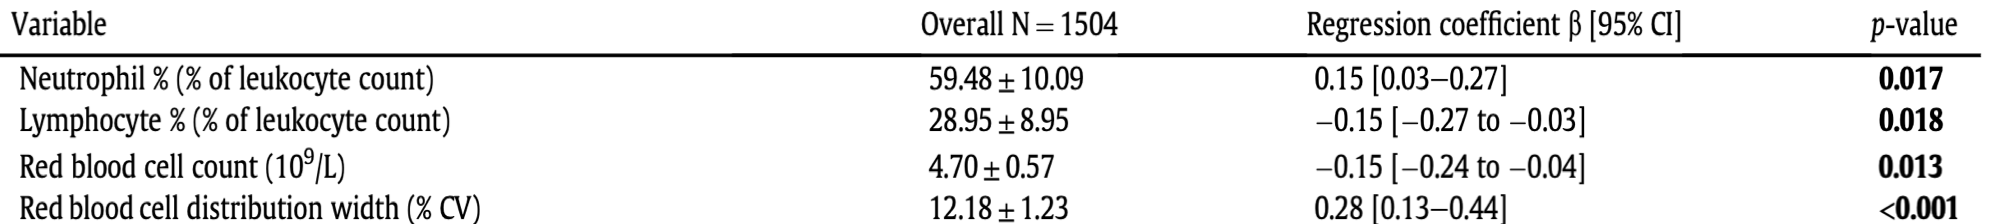
Are blood biomarkers associated with CAC? When the CAC score was elevated, a greater percentage of white blood cells (WBCs) that were neutrophils and the red blood cell distribution width (RDW%) were higher, whereas lower CAC scores were associated with higher levels for the fraction of lymphocytes divided by total WBCs and higher total red blood cells (den Harder et al. 2018):
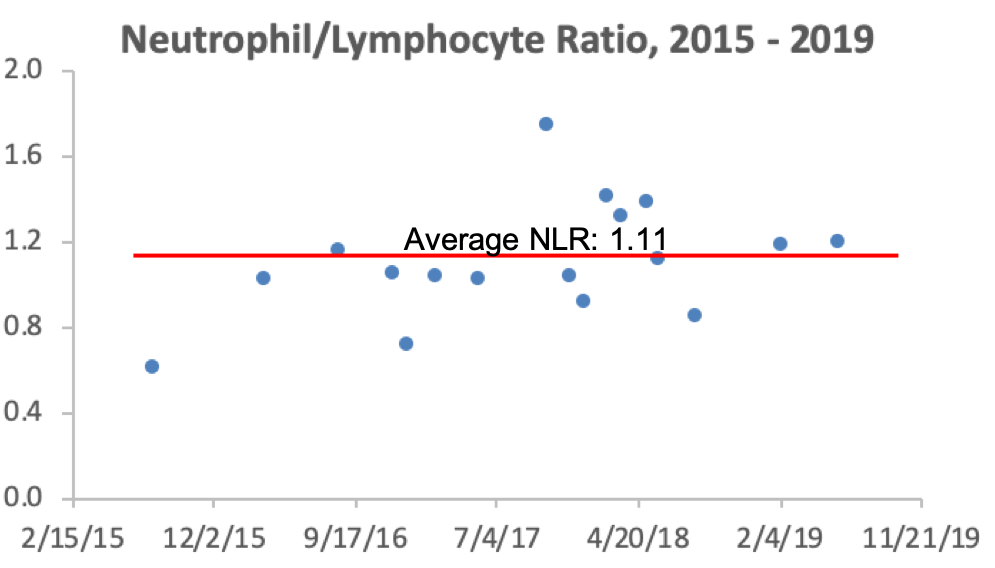
In agreement with these data, CAC scores > 100 were associated with a higher RDW% (13.0%) and a higher neutrophil/lymphocyte ratio (NLR; 1.54), when compared with CAC < 100 (RDW = 12.8%; NLR = 1.39; Gürel et al. 2019).
The findings that a higher RDW% and higher levels of neutrophils, but lower levels of lymphocytes are associated with a higher CAC score is in agreement with the data for how these variables change with aging and their associations with all-cause mortality risk. First, note that I previously reported that RDW% increases during aging and is associated with an increased risk of death from all causes (https://michaellustgarten.wordpress.com/2019/09/25/optimizing-biological-age-rdw/). Similarly, neutrophils increase, whereas lymphocytes decrease, thereby leading to a higher neutrophil/lymphocyte ratio during aging, which is associated with an increased all-cause mortality risk (https://michaellustgarten.wordpress.com/2019/10/10/neutrophil-lymphocyte-ratio-and-survival/).
If you’re interested, please have a look at my book!
References
den Harder AM, de Jong PA, de Groot MCH, Wolterink JM, Budde RPJ, Iŝgum I, van Solinge WW, Ten Berg MJ, Lutgens E, Veldhuis WB, Haitjema S, Hoefer IE, Leiner T. Commonly available hematological biomarkers are associated with the extent of coronary calcifications. Atherosclerosis. 2018 Aug;275:166-173. doi: 10.1016/j.atherosclerosis.2018.06.017.
Gürel OM, Demircelik MB, Bilgic MA, Yilmaz H, Yilmaz OC, Cakmak M, Eryonucu B. Association between RedBloodCellDistributionWidth and CoronaryArteryCalcification in PatientsUndergoing64-MultidetectorComputedTomography. Korean Circ J. 2015 Sep;45(5):372-7. doi: 10.4070/kcj.2015.45.5.372.
Hartaigh BÓ, Valenti V, Cho I, Schulman-Marcus J, Gransar H, Knapper J, Kelkar AA, Xie JX, Chang HJ, Shaw LJ, Callister TQ, Min JK. 15-Year prognostic utility of coronary artery calcium scoring for all-causemortality in the elderly. Atherosclerosis. 2016 Mar;246:361-6. doi: 10.1016/j.atherosclerosis.2016.01.039.
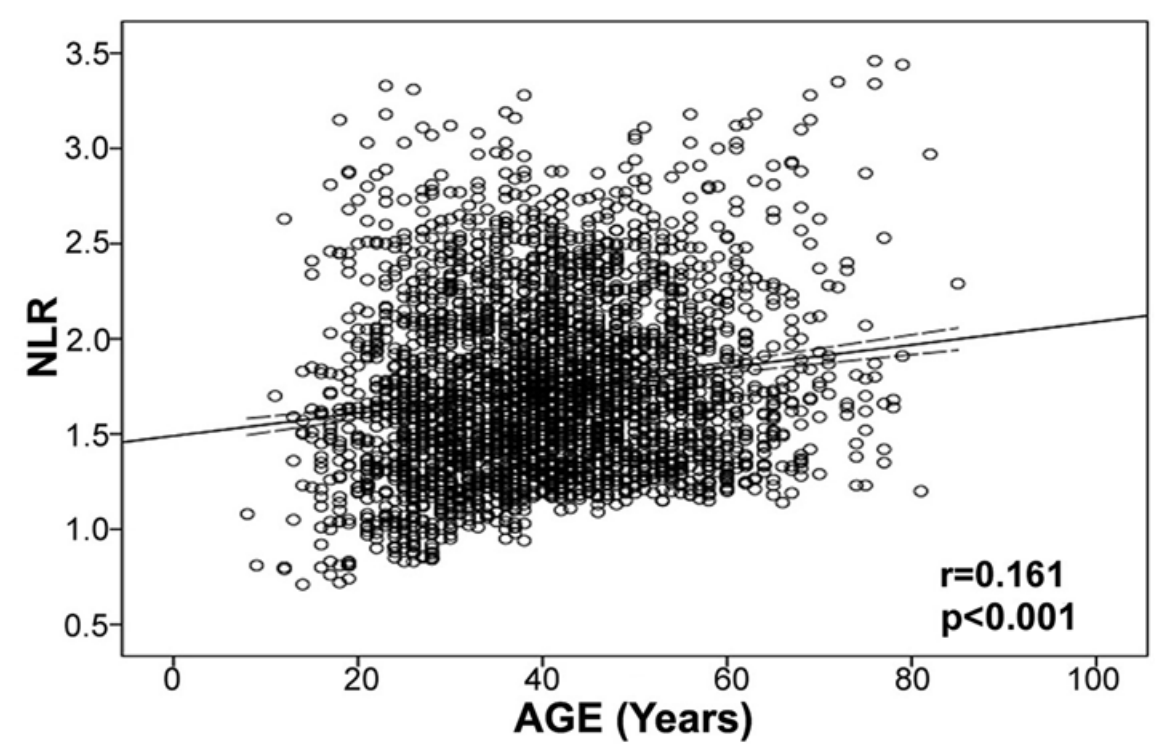
However, within WBCs, neutrophils increase, whereas lymphocytes decrease during aging (Ruggiero et al. 2007, Starr and Dreary 2011). As a result, the ratio between neutrophils with lymphocytes (NLR) increases during aging from ~1.5 in 20 year olds to ~1.8 in adults older than 75y (Li et al. 2015):
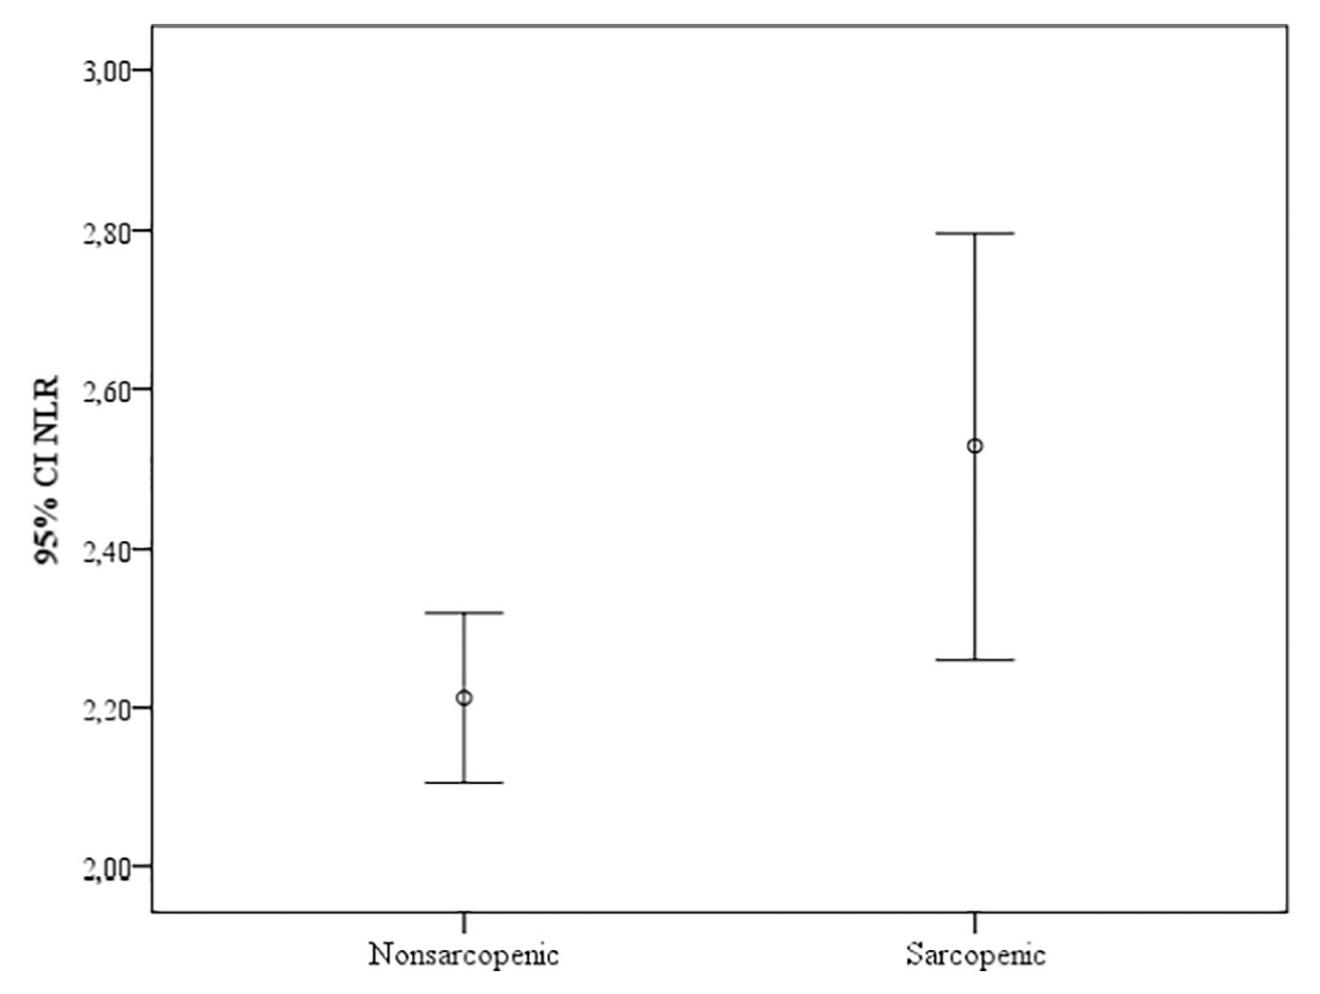
An increased neutrophil/lymphocyte ratio during aging may be bad for health and disease risk. First, a higher neutrophil/lymphocyte ratio is associated with sarcopenia (defined as the age-related loss of muscle mass and physical function) in older adults (average age, 72y; Öztürk et al. 2018):
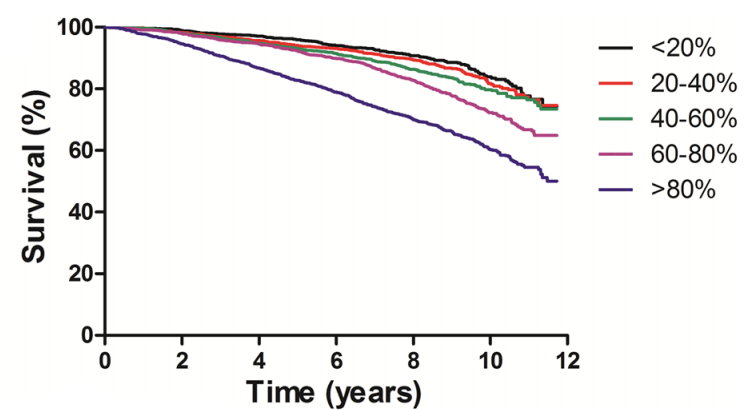
Second, risk of death for all causes is significantly increased for older adults (average age, 66y) that had higher NLR values (60-80%, >80%, equivalent to NLR = 1.92-2.41, > 2.41), when compared with lower NLR values (< 20%, 20-40%, 40-60%, equivalent to NLR < 1.90; Fest et al. 2019):
Similarly, all-cause mortality risk was 30% increased in older adults (average age, 54y) that had NLR values > 1.77, when compared with < 1.77, and 40% increased for NLR values > 2.15, when compared with < 2.15 (Kime et al. 2018).
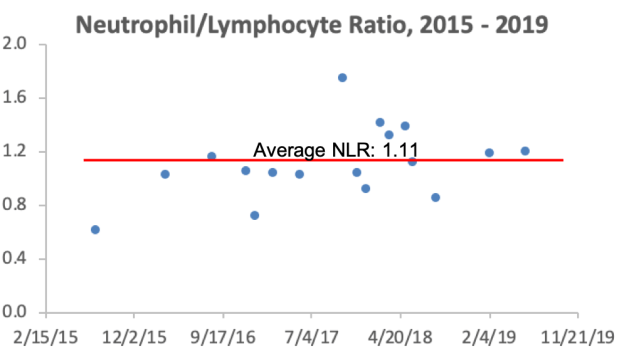
What are my NLR values? Over 17 blood test measurements from 2015 – 2019, my average NLR is 1.11. So far so good!
If you’re interested, please have a look at my book!
References
Fest J, Ruiter TR, Groot Koerkamp B, Rizopoulos D, Ikram MA, van Eijck CHJ, Stricker BH. The neutrophil-to-lymphocyte ratio is associated with mortality in the general population: The Rotterdam Study. Eur J Epidemiol. 2019 May;34(5):463-470.
Kim S, Eliot M, Koestler DC, Wu WC, Kelsey KT. Association of Neutrophil-to-Lymphocyte Ratio With Mortality and Cardiovascular Disease in the Jackson Heart Study and Modification by the Duffy Antigen Variant. JAMA Cardiol. 2018 Jun 1;3(6):455-462. doi: 10.1001/jamacardio.2018.1042.
Li J, Chen Q, Luo X, Hong J, Pan K, Lin X, Liu X, Zhou L, Wang H, Xu Y, Li H, Duan C. Neutrophil-to-LymphocyteRatioPositivelyCorrelates to Age in HealthyPopulation. J Clin Lab Anal. 2015 Nov;29(6):437-43. doi: 10.1002/jcla.21791.
Öztürk ZA, Kul S, Türkbeyler İH, Sayıner ZA, Abiyev A. Is increased neutrophillymphocyte ratio remarking the inflammation in sarcopenia? Exp Gerontol. 2018 Sep;110:223-229.
Ruggiero C, Metter EJ, Cherubini A, Maggio M, Sen R, Najjar SS, Windham GB, Ble A, Senin U, Ferrucci L. White blood cell count and mortality in the Baltimore Longitudinal Study of Aging. J Am Coll Cardiol. 2007 May 8;49(18):1841-50.
Starr JM, Deary IJ. Sex differences in blood cell counts in the Lothian Birth Cohort 1921 between 79 and 87 years. Maturitas. 2011 Aug;69(4):373-6.
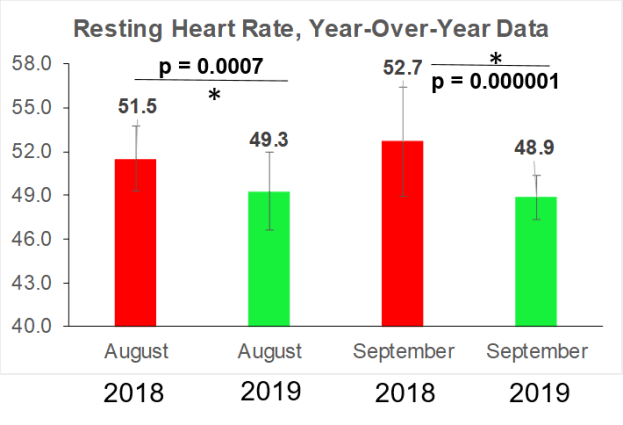
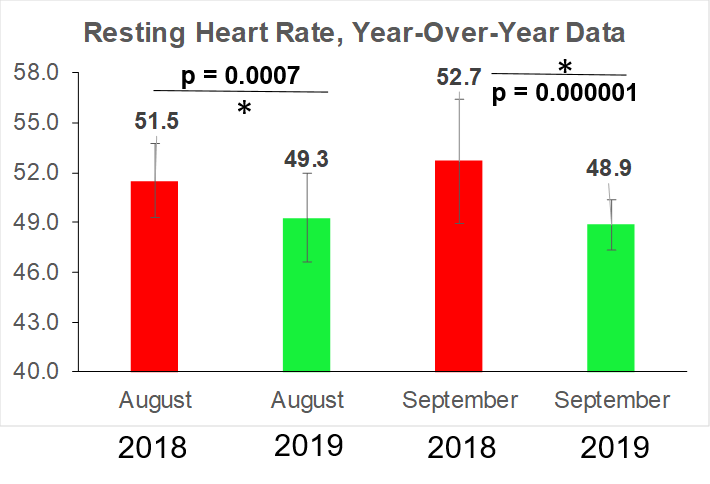
A few months ago, I presented data that a resting heart rate (RHR) ~40 beats per min is associated with maximally reduced risk of death from all causes (https://michaellustgarten.wordpress.com/2019/02/02/resting-heart-rate-whats-optimal/). I started tracking my RHR data in August 2018, and I now have more than a full year of data. RHR increases during aging, so how does my RHR look over that past year+?
As you can see, the trend line (red) is down, not up, which suggests that my fitness program is on the right track. My improvements for RHR can be better illustrated by comparing year-over-year changes for August 2018 with August 2019, and similarly, for September:
The challenge will be continuous improvement for RHR. Eventually it will plateau, and I’ll respond by modifying my fitness program to make further gains.
If you’re interested, please have a look at my book!
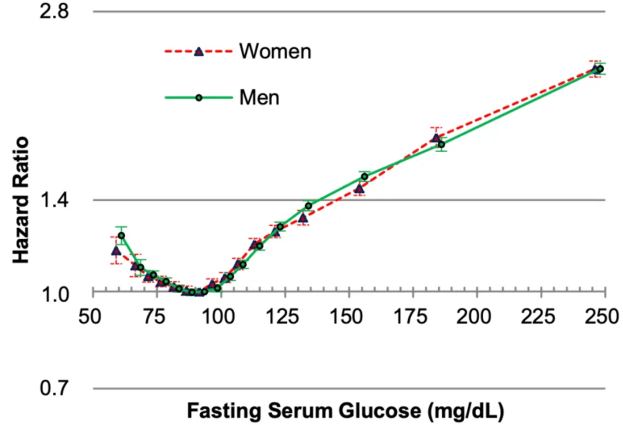
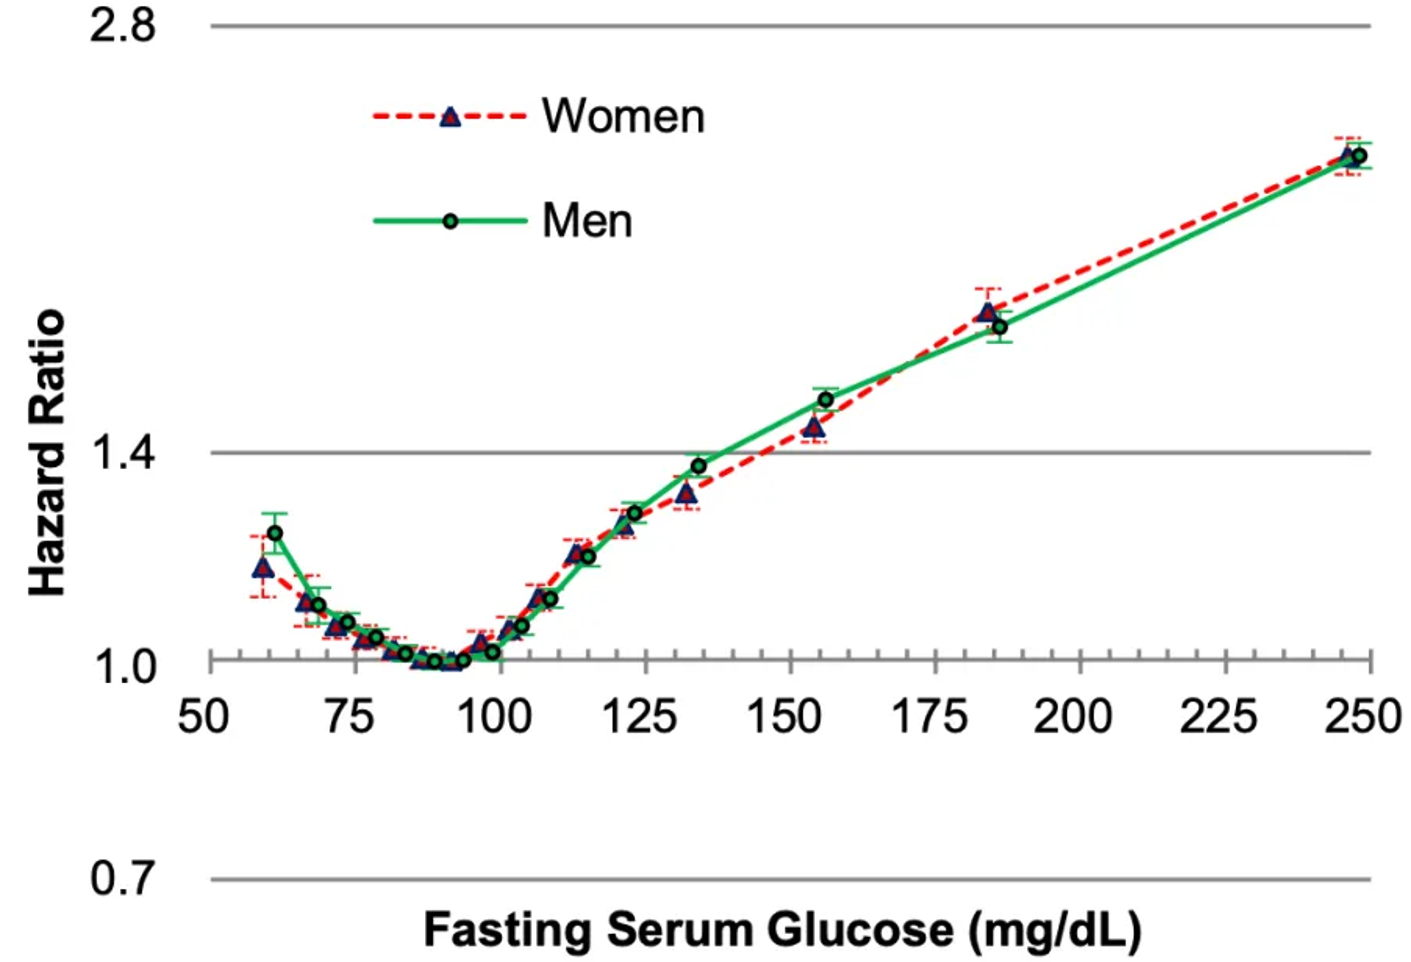
In the largest study published for this subject (12,455,361 adults), risk of death for all causes was maximally reduced for glucose levels between 80-94 mg/dL (Yi et al. 2017). In contrast, mortality risk significantly increased when glucose levels were < 80 or > 100 mg/dL in both men and women:
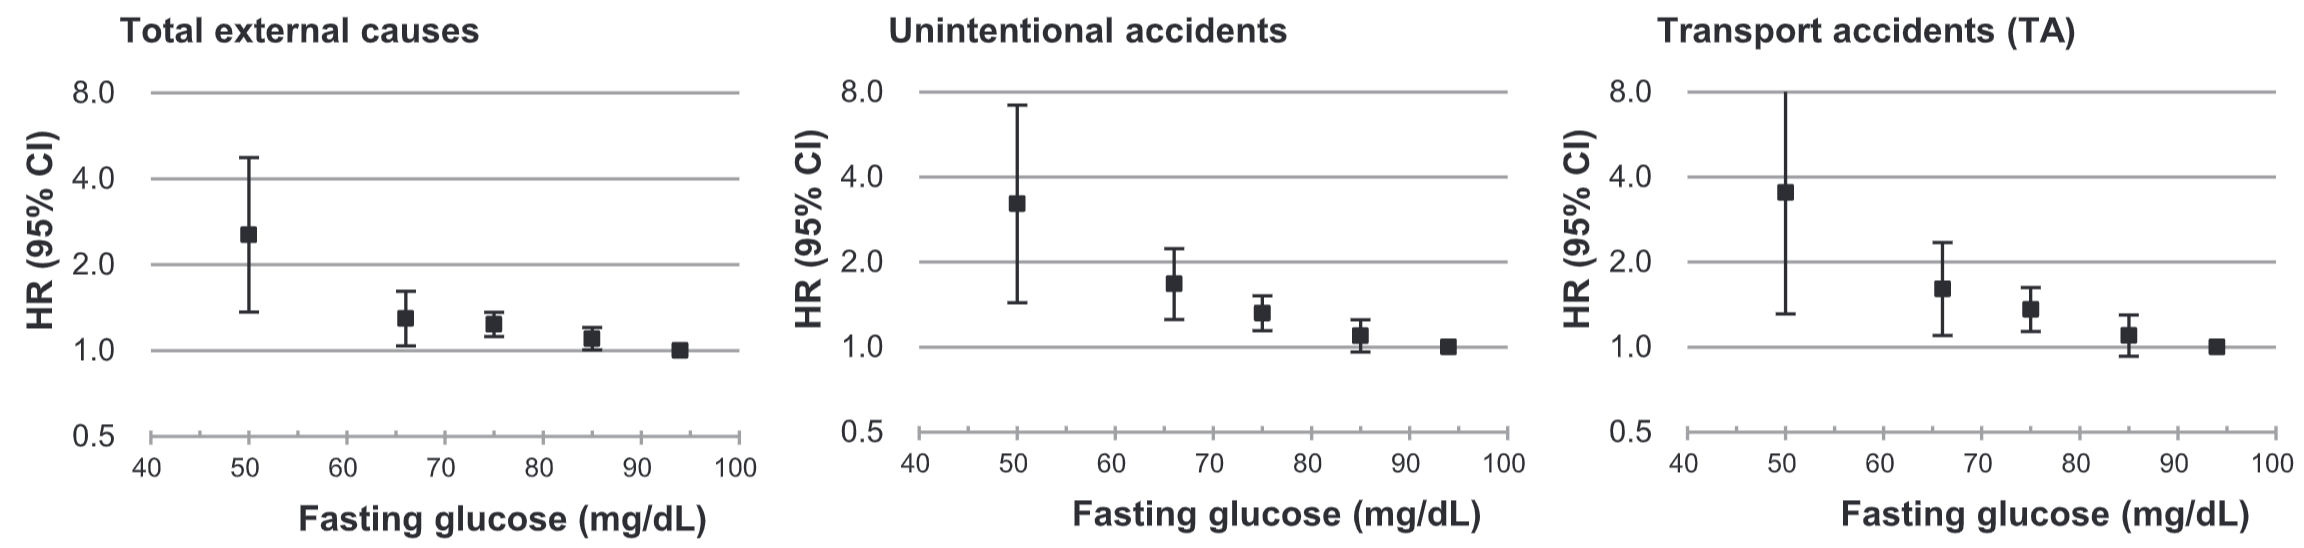
As glucose levels rise above 100 mg/dL, risk for Type II diabetes increases, which is one potential explanation for higher glucose levels being associated with a higher mortality risk. Why would glucose levels lower than 80 mg/dL also be associated with worse health? Interestingly, glucose levels < 80 mg/dL are associated with an increased risk of death from “total external causes” (left panel below), including unintentional accidents and transport accidents (middle, right panel below) in a relatively large study of 345,318 adults (Yi et al. 2019). In addition, an increased mortality risk from transport accidents involving pedestrians or cyclists was associated with glucose levels below 55 mg/dL (data not shown):
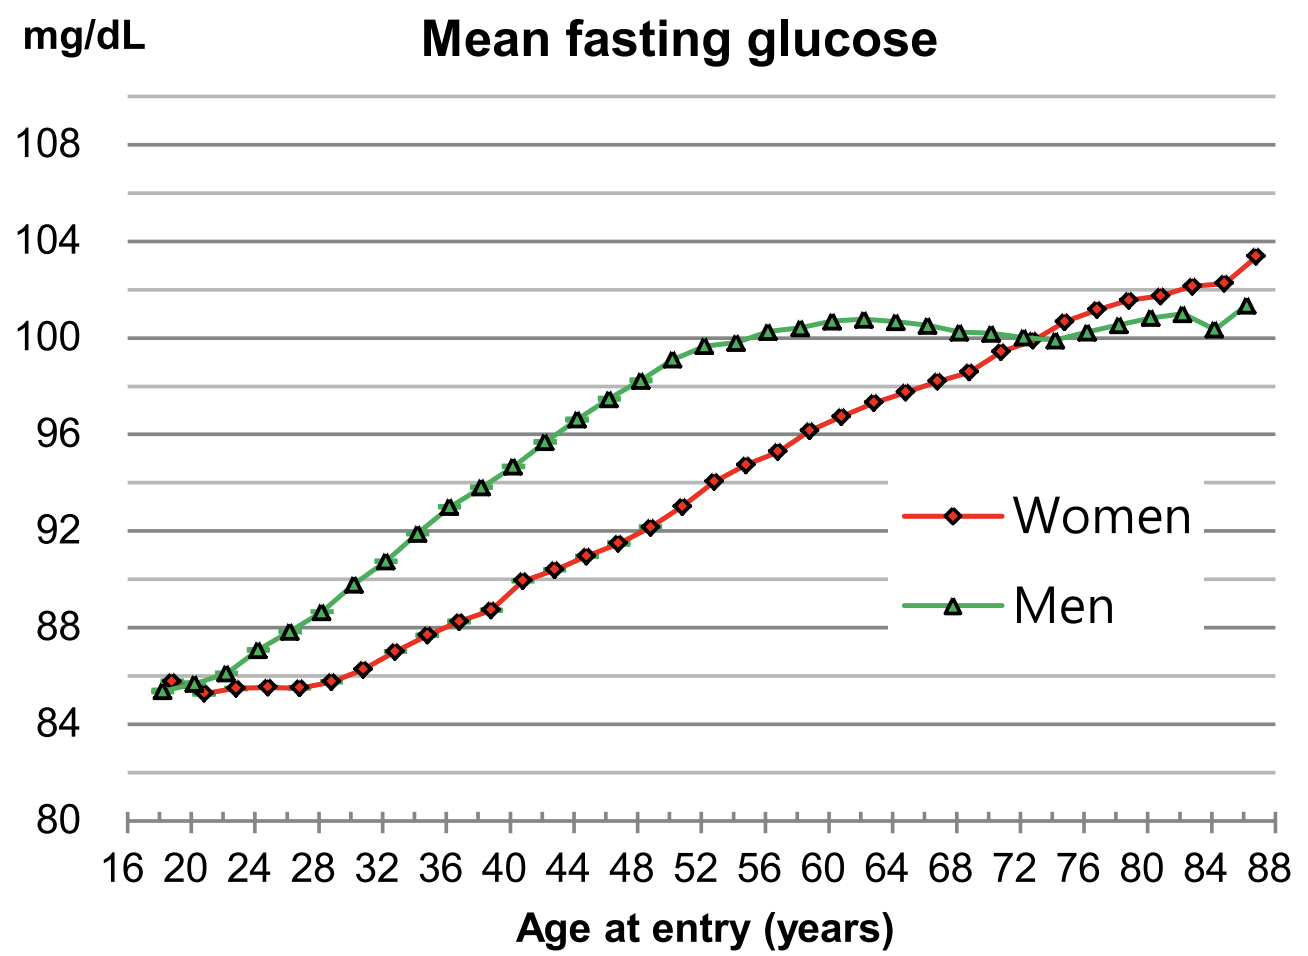
Glucose levels increase during aging (Yi et al. 2017), evidence that adds further merit that lower is better (but not below 80 mg/dL!):
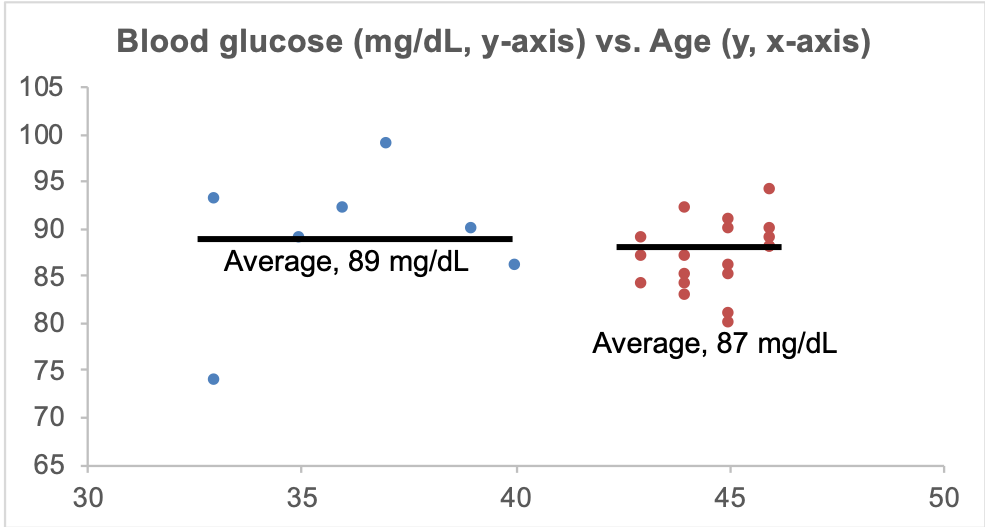
What are my glucose levels? Shown below is my data for the past 13 years:
On the left side of the chart, I measured my glucose levels about once per year from 33-40y, resulting in an average value of 89 mg/dL. Since 2015 I started daily dietary tracking, and tested more often (19x), resulting in an average value of 87 mg/dL. The comparison between these 2 groups of data is not significantly different (p=0.19). Based on the data in Yi et al., my glucose levels should have increased from 92 to 96 mg/dL during the past 13 years. Instead, my glucose levels during that period are relatively stable, with average value (87.5 mg/dL) that would be expected for a 26y old. So far, so good!
If you’re interested, please have a look at my book!
References
Yi SW, Park S, Lee YH, Park HJ, Balkau B, Yi JJ. Association between fastingglucose and all-cause mortality according to sex and age: a prospectivecohortstudy. Sci Rep. 2017 Aug 15;7(1):8194. doi: 10.1038/s41598-017-08498-6.
Yi SW, Won YJ, Yi JJ. Lownormalfastingglucose and risk of accidentaldeath in Koreanadults: A prospectivecohortstudy. Diabetes Metab. 2019 Jan;45(1):60-66. doi: 10.1016/j.diabet.2018.01.005.
In the first half of this presentation, I talk about my contribution to the gut-muscle axis in older adults, and in the second half, my personalized approach to optimal health!
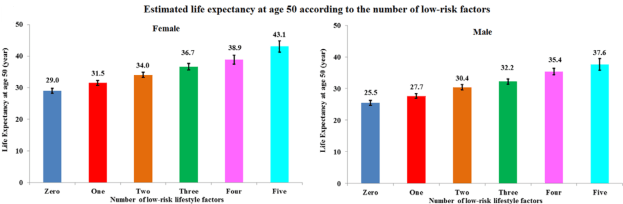
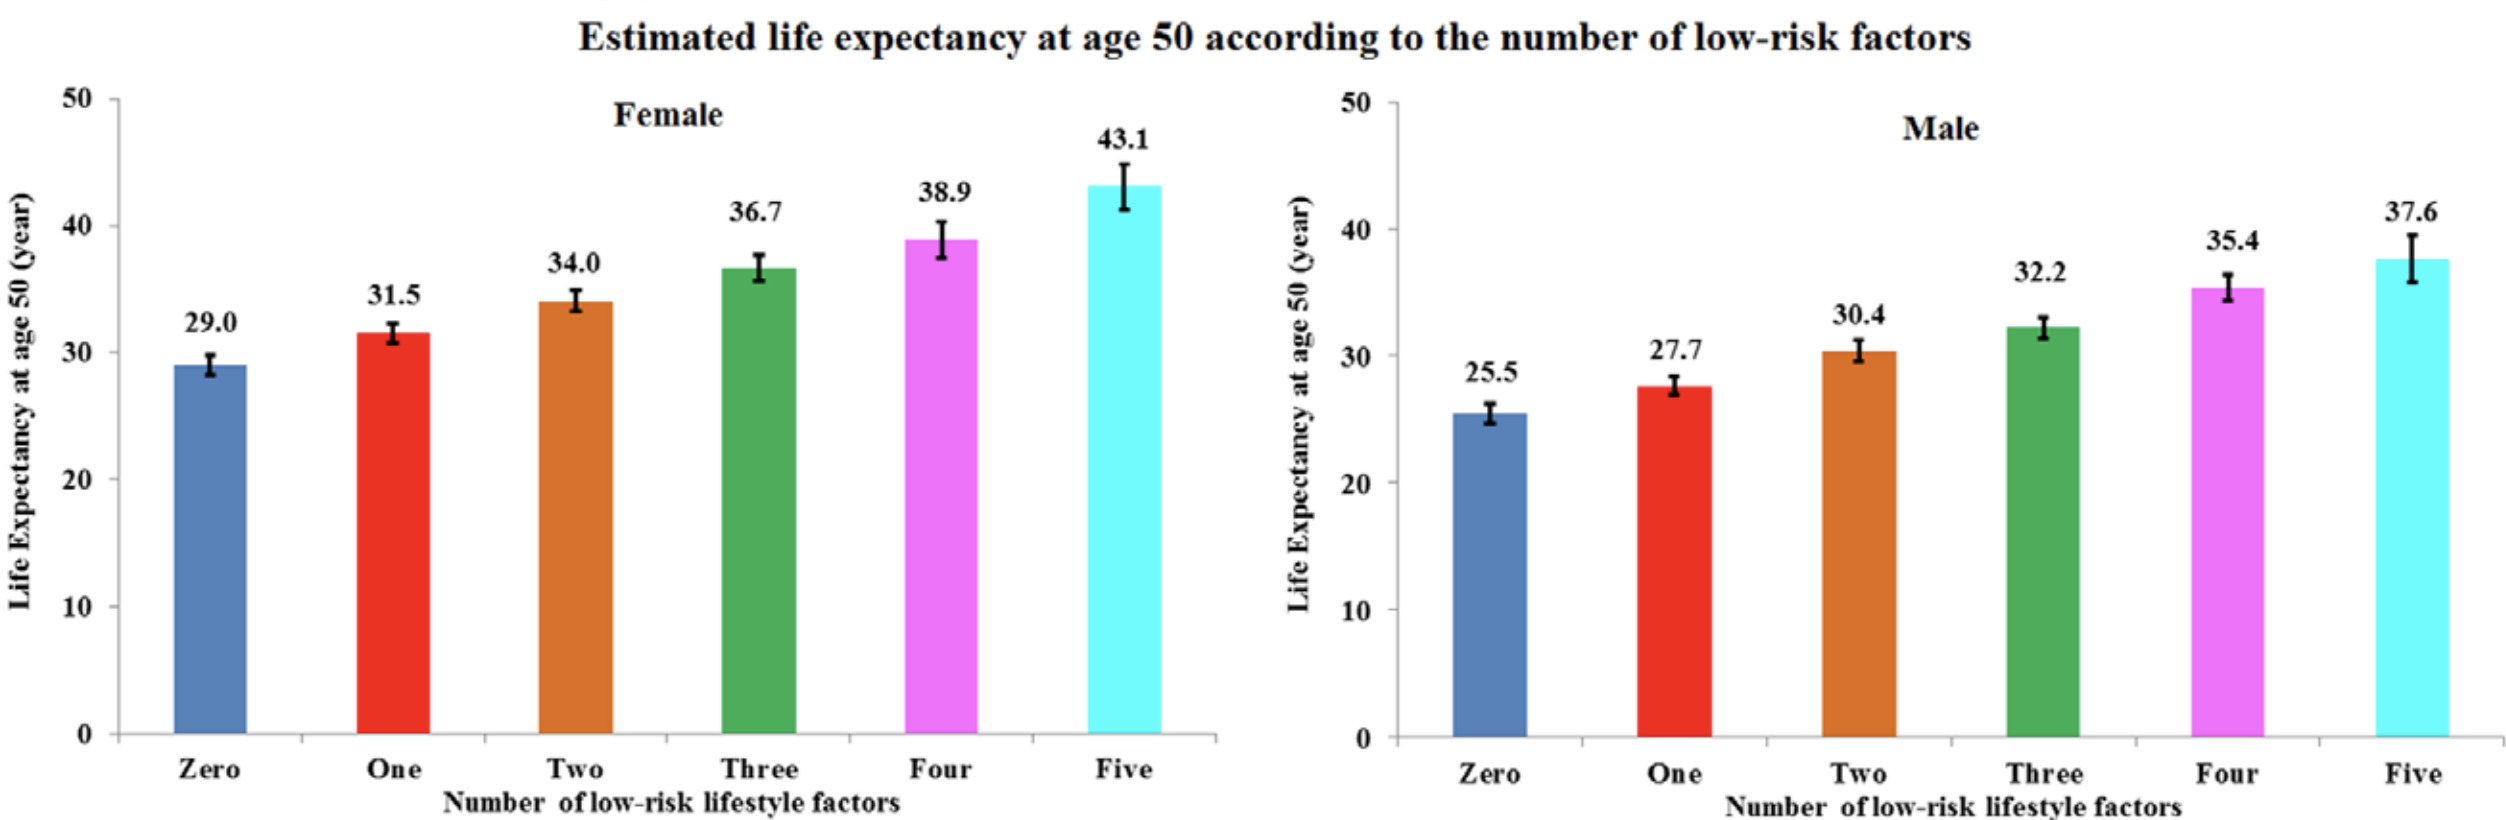
Following five lifestyle-related factors is associated with a gain in average life expectancy (Li et al. 2018). What are these factors? Not smoking, having a BMI between 18.5 to 24.9 kg/m2, engaging in more than 30 minutes of moderate to vigorous physical activity (at a minimum, walking ~3 miles per hour; 30 minutes of that = 1.5 miles of walking per day), moderate alcohol intake (5 to 15 g/d for women and 5 to 30 g/d for men), and a high diet quality score.
Starting at age 50y, having all 5 of these factors was associated with a life expectancy of an additional 43.1 years for women, and 37.6 years for men, which is an increase in average life expectancy of 14 years for women and 12 years for men, respectively:
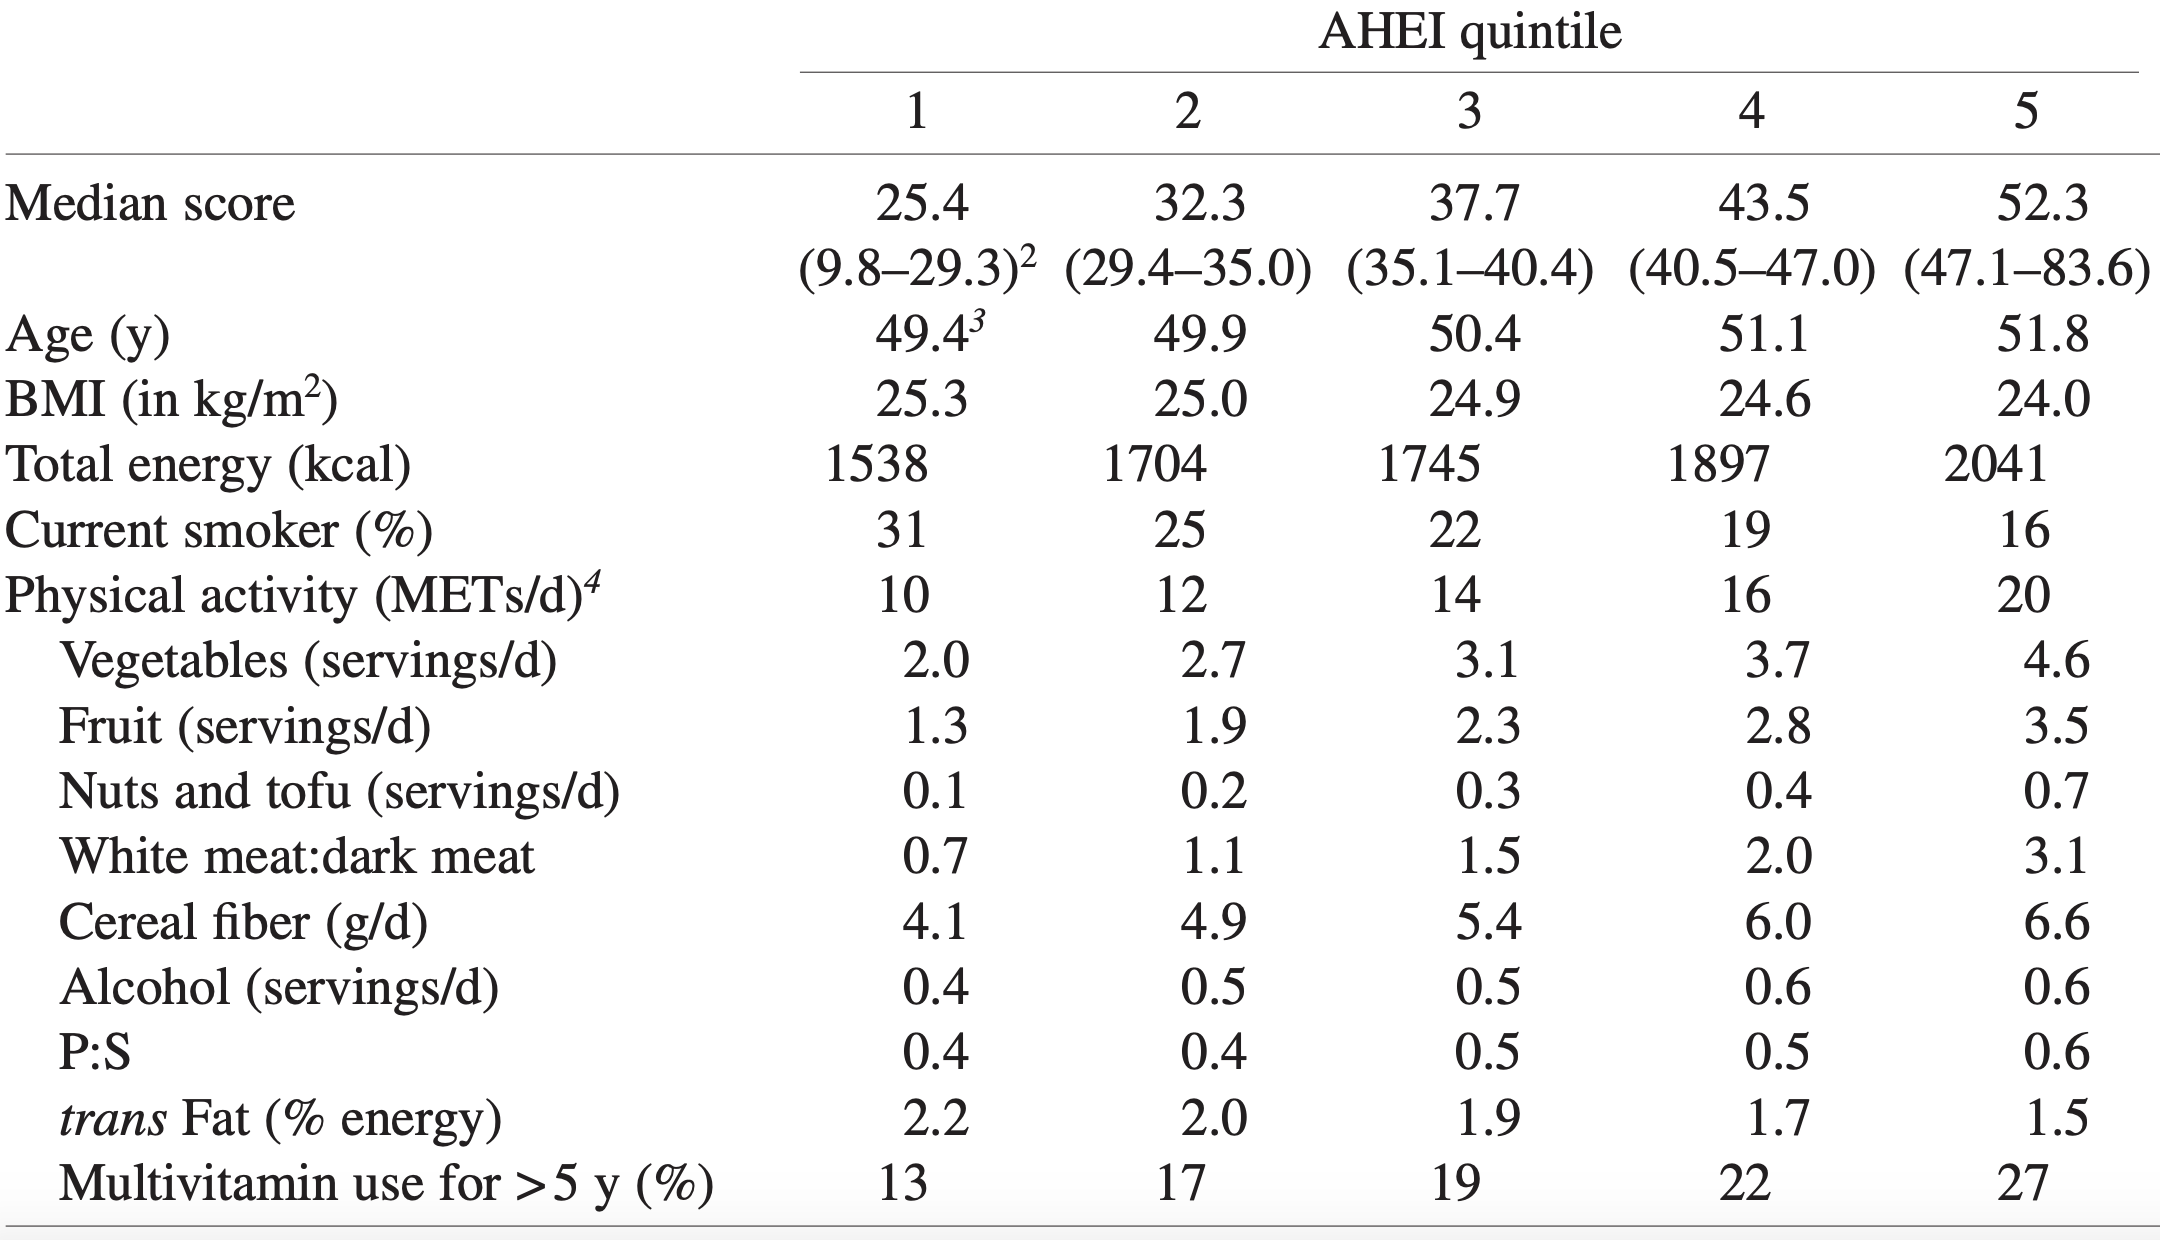
Quantifying whether or not you have the first 4 factors is easy, but what qualifies as having a high dietary score? The alternative healthy eating index (AHEI; McCullough et al. 2002) was used to define the dietary score. An AHEI score of more than 43.5 in women and 50 in men qualifies as having a high dietary quality. How is the AHEI defined?
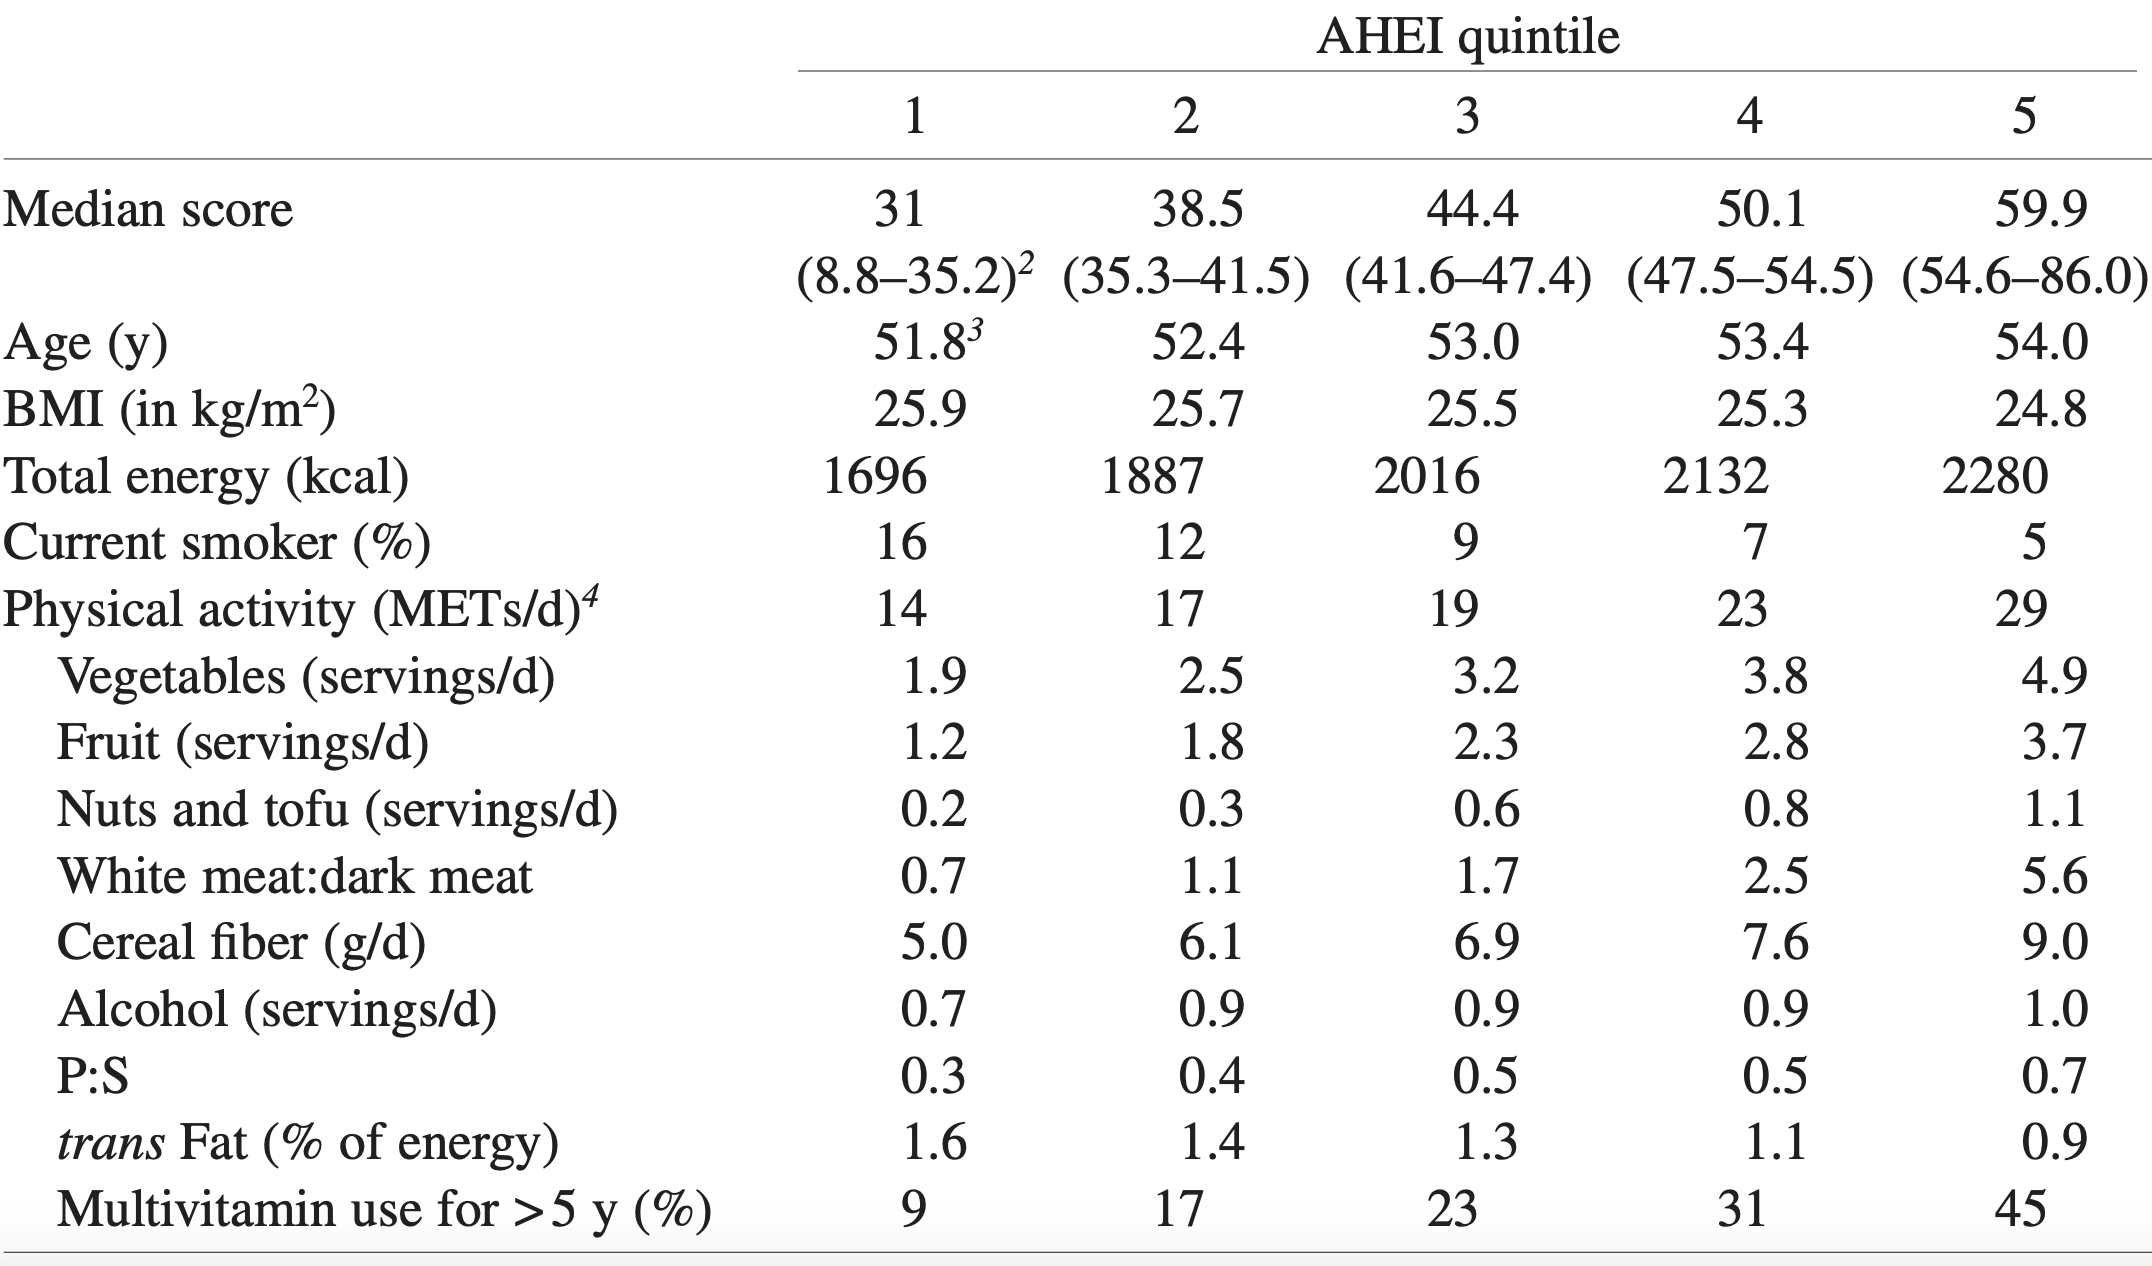
If you eat more than 5 servings of vegetables (1 serving = ~3 ounces, or 80g) per day, you get 10 points. Similarly, more than 4 servings of fruit gets you 10 points. If you eat 1 serving (= 1.5 ounces, or 42 grams) of nuts and or soy protein (tofu) you get 10 points. If your intake of white meat (including fish, poultry) divided by red meat is greater than 4, you get 10 points. If you eat > 9 grams of cereal fiber (not 9 grams of grains, but the actual fiber content) per day, you get 10 points. For example, 9 grams of cereal fiber corresponds to 90g/day of dry oats. Alcohol is also included within the AHEI: if you have 1.5 – 2.5 servings of alcoholic drinks per day (for men) or 0.5 – 1.5 servings/day for women, that’s 10 points. Zero points would be not consuming alcoholic drinks, or > 3.5 drinks for men, and > 2.5 drinks per day for women. Having a polyunsaturated/saturated fat (P:S) intake > 0.5 yields 8 points, whereas a ratio > 0.7 yields 10 points. Consuming < 0.9 grams of trans fat per day yields 10 points, and finally, using a multivitamin for more than 5 years yields 10 points. To determine your score, have a a look at the median AHEI values reported for men:
And for women:
How many of the 5 factors do I have? I don’t smoke, my BMI is within the BMI range (my body weight was 158 this morning, so barely!), and I easily walk more than an hour/day + 3-4 days of exercise/week, so I qualify for the first 3 factors. However, I rarely drink alcohol, so I don’t qualify for that factor. What about the diet quality factor? To determine that, I’ll need to calculate if I have more than 50 AHEI points.
For the AHEI index, getting 5, 4, and 1 servings of veggies, fruit, and nuts per day is easy for me, so I’ve got 30 points so far. I eat oats once or twice/week, but not enough to get 9g of cereal fiber/day, so 0 points there. I eat 80 grams of sardines every day (560 grams/week), and ~150 grams of red meat per week, for a ratio of 3.7. That wouldn’t qualify me for 10 points, but 8 instead (see Quintile 4), where the white/red meat ratio would need to be higher than 2.5. I rarely drink alcohol, so 0 points for me there. Using last week’s dietary data, my P:S ratio is about 0.5, and my trans fat intake (almost exclusively from full-fat dairy) is 0.7 g/day, so I get 8 points and 10 points, respectively. In terms of multivitamin use, I only supplement with Vitamin D in the winter, and with a methylfolate-methylcobalamin-B6 stack (to reduce my homocysteine by ~10%). I haven’t been supplementing with that stack for more than five years, so I get a 0 there. Nonetheless, my score is 56 points, which would qualify me as having a high diet quality score.
Collectively, I have 4 of the 5 lifestyle factors that are associated with an increase in life expectancy. Based on the data from Li et al., my average life expectancy would be 85.4y. Adding in moderate alcohol intake would give me all 5 factors, and would result in a life expectancy gain of an additional 2.2 years. I’ve included 1-2 glasses of wine in my diet in the past, but it had no effect on my HDL or other circulating biomarkers, so I removed it. For me, the risk related to alcohol intake may not be worth the gain in life expectancy. Also note that these are average, population-based values, and I expect an additional gain in life expectancy gain because of my continuous quest for biological age optimization (https://michaellustgarten.wordpress.com/2019/09/09/quantifying-biological-age_!
References
Li Y, Pan A, Wang DD, Liu X, Dhana K, Franco OH, Kaptoge S, Di Angelantonio E, Stampfer M, Willett WC, Hu FB. Impact of Healthy Lifestyle Factors on Life Expectancies in the US Population. Circulation. 2018 Jul 24;138(4):345-355. doi: 10.1161/CIRCULATIONAHA.117.032047.
McCullough ML, Feskanich D, Stampfer MJ, Giovannucci EL, Rimm EB, Hu FB, Spiegelman D, Hunter DJ, Colditz GA, Willett WC. Dietquality and majorchronicdiseaserisk in men and women: movingtowardimproveddietaryguidance. Am J Clin Nutr. 2002 Dec;76(6):1261-71.
If you’re interested, please have a look at my book!
Can biological age be optimized? The red blood cell (RBC) distribution width (RDW%) is one of the variables included in the PhenoAge biological age calculator (see https://michaellustgarten.wordpress.com/2019/09/09/quantifying-biological-age/). Although the RDW% reference range is 11.5% – 14.5%, what values are optimal in terms a youthful biological age, and minimized disease risk?
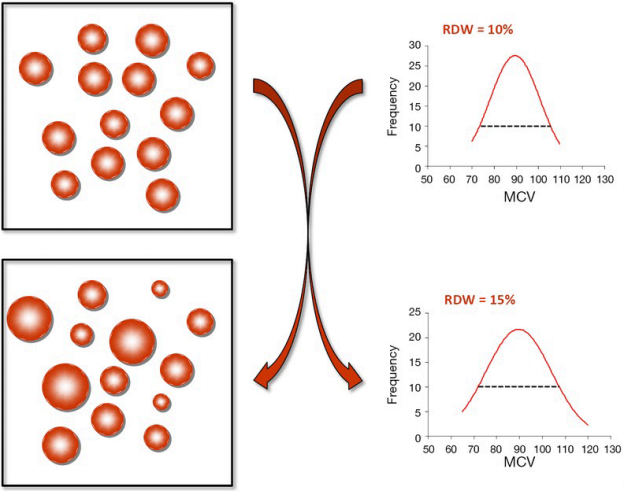
First, let’s define RDW%. RDW% is calculated by dividing the standard deviation of the average mean corpuscular volume (i.e. the average volume inside red blood cells, defined as MCV, upper right panel; image via Danese et al. 2015). When the volume inside red blood cells is approximately the same across all RBCs (upper left panel), the RDW% will be narrow, as shown by the dashed line in the upper right panel. Conversely, during aging and in many diseases, the size and volume of RBCs are altered, resulting in a more broad RDW% (bottom left and right panels):
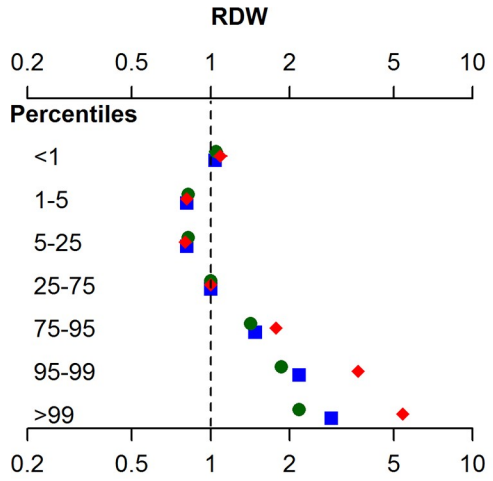
In terms of RDW%, what’s optimal for health and longevity? In the the largest study (3,156,863 subjects) that investigated the association for risk of death for all causes with RDW%, maximally reduced risk of death was observed for RDW% between 11.4 – 12.5% (percentiles 1-5, 5-25), with mortality risk increasing for values < 11.3%, and > 12.6% (Tonelli et al. 2019):
This has been confirmed in other relatively large studies (240,477 subjects), as RDW% values < 12.5% were associated with maximally reduced all-cause mortality risk, with values > 12.5 associated with an increasing all-cause mortality risk (Pilling et al. 2018):
How does RDW% change during aging? For the 1,907 subjects of Lippi et al. (2014), RDW% increased during aging:
In support of this finding, RDW% also increased during aging in a larger study that included 8,089 subjects (Hoffmann et al. 2015).
Collectively, when considering the all-cause mortality and aging data, RDW% values ~ 12.5% may be optimal for health and longevity. What are my RDW% values? Plotted below are 18 RDW% measurements since 2015 (blue circles). First, note my average RDW% during that time (black line) is 12.8%, which isn’t far from the 12.5% that may be optimal for health and longevity. However, note the trend line (red), which indicates that my RDW% values are increasing during aging!
How do I plan on reducing my RDW%? A moderate strength correlation exists between my calorie intake with RDW% (r = 0.53), with a higher daily average calorie intake being associated with a higher RDW%:
My plan is to shoot for a daily calorie intake ~2600 over the next month, and then retest my RDW% (and the rest of the CBC). Hopefully that brings my RDW% down to 12.5% or less. If that doesn’t work, I’ll re-calibrate, and try something else!
If you’re interested, please have a look at my book!
References
Danese E, Lippi G, Montagnana M. Red blood cell distribution width and cardiovascular diseases. J Thorac Dis. 2015 Oct;7(10):E402-11. doi: 10.3978/j.issn.2072-1439.2015.10.04.
Hoffmann JJ, Nabbe KC, van den Broek NM. Red cell distribution width and mortality in older adults: a meta-analysis. Clin Chem Lab Med. 2015 Nov;53(12):2015-9. doi: 10.1515/cclm-2015-0155.
Lippi G, Salvagno GL, Guidi GC. Red blood celldistributionwidth is significantly associated with aging and gender. Clin Chem Lab Med. 2014 Sep;52(9):e197-9. doi: 10.1515/cclm-2014-0353.
Pilling LC, Atkins JL, Kuchel GA, Ferrucci L, Melzer D. Red cell distribution width and common disease onsets in 240,477 healthy volunteers followed for up to 9 years. PLoS One. 2018 Sep 13;13(9):e0203504. doi: 10.1371/journal.pone.0203504.
Tonelli M, Wiebe N, James MT, Naugler C, Manns BJ, Klarenbach SW, Hemmelgarn BR. Red cell distribution widthassociations with clinicaloutcomes: A population-basedcohort study. PLoS One. 2019 Mar 13;14(3):e0212374. doi: 10.1371/journal.pone.0212374.