Blood Testing: Optimizing Glucose and CRP, and including my own tracked data!
Leave a reply

In the first 45 minutes, discuss each of the biomarkers contained within Levine’s Biological Age calculator, Phenotypic Age.
After that, I answer questions from the audience and we discuss all things related to aging.
Exactly 1 month ago, my first biological age measurement of 2020 was 32.75y (https://michaellustgarten.wordpress.com/2020/02/14/biological-age-32-75y-chronological-age-47y-first-2020-measurement/). When considering that my chronological age is 47y, that’s a 14 year improvement, but I wasn’t (and still aren’t) satisfied. When I sent my blood for analysis, I was battling a mild upper respiratory infection (cough, no fever), which likely raised my WBCs, thereby resulting in a higher biologic age. Also, I was experimenting with a higher intake of meat, eggs, and cheese, to see what affect that it would have on my circulating biomarkers. On that blood test in February, my creatinine levels were higher than my 2015-2020 average value, and if those foods were associated with circulating levels of creatinine, reducing them should also reduce creatinine, and accordingly, further improve my biological age. I also assumed that all other variables on Levine’s Phenotypic Age calculator would be unchanged.
On March 9 2020, I sent my blood for analysis so that I could calculate biological age with Levine’s PhenotypicAge. Almost exactly as expected, my WBCs (4.7 * 10^3 cells/microliter) were closer to my 2015-2020 average value (4.6), rather than the higher value (5.8) in my blood test last month. Similarly, reducing my intake of beef, eggs, and cheese brought creatinine from 1.08 to 0.97 mg/dL, which is closer to its 5-year average (0.94 mg/dL). As a result, I further reduced my biological age by 1.14 years to 31.61y, which is 15+ years younger than my chronological!

Because I track my diet every day, I can investigate the correlation between my meat, eggs, and cheese intake with creatinine. I now have 8 blood tests that correspond to dietary data, and interestingly, there is a moderately strong correlation between my average daily beef+egg+cheese intake with creatinine (r = 0.55). Based on these data, I’m going to continue to minimize consumption of these foods, with the goal of optimizing creatinine.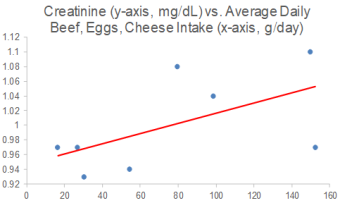
On a final note, I also expected to further reduce my CRP from 0.3 to something lower, but it slightly increased to 0.37 mg/L. While that is far from a high value, lower is better, and in future blood tests I’ll try to figure out how to further reduce it.
If you’re interested in calculating your biological age, here’s the Excel link:
In terms of all-cause mortality risk, is the reference range for circulating triglycerides (TG, <150 mg/dL) optimal?
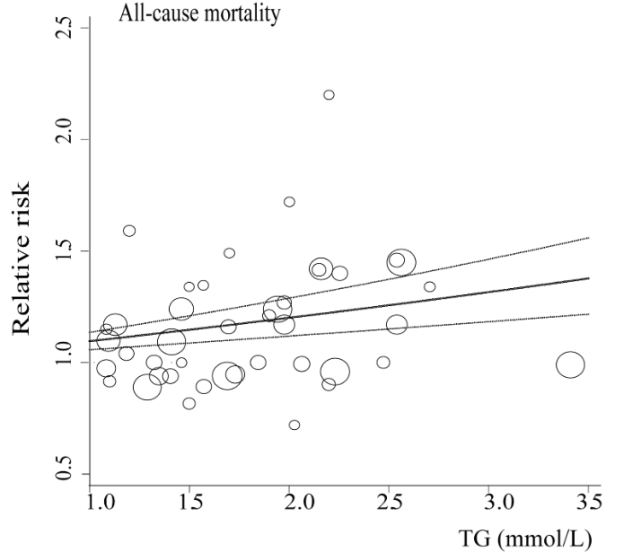
A meta-analysis of 38 studies in 360,556 subjects with a median age of 48y and a 12-year follow-up reported lowest all-cause mortality risk for subjects with TG values less than 90 mg/dL (equivalent to ~1 mmol; Liu et al. 2013). As shown below, each successive 90 mg/dL increase was associated with a 12% higher all-cause mortality risk. A person with a value closer to the high end of the reference range, ~150 would have a ~7% increased mortality risk compared someone with a value ~90. In other words, there would be 7 more deaths per 100 total people at a TG value of 150, compared with the death rate for people with values less than 90.

Added importance for the association between TG values less than 90 with all-cause mortality risk come from studies of people who have lived longer than 100 years, centenarians. As shown below, triglyceride values less than 101 mg/dL have been reported in 9 of 11 centenarian studies:

What’s my TG value? As shown below, I’ve measured triglycerides 23 times since 2015, with an average value of 52 mg/dL:
With the goal of keeping triglyceride levels low, are there dietary factors that influence it? When compared with my dietary data, the strongest correlation (r = 0.73, R2=0.5339) is present for triglycerides with my calorie intake. In other words, a higher daily calorie intake is associated with higher levels of triglycerides:

Based on this correlation, should my triglycerides start to rise in the future, a first step would be reducing my average daily calorie intake, which since October 2019 has been ~2550 calories/day.
If you’re interested, please have a look at my book!
References
Liu J, Zeng FF, Liu ZM, Zhang CX, Ling WH, Chen YM. Effects of blood triglycerides on cardiovascular and all-cause mortality: a systematic review and meta-analysis of 61 prospective studies. Lipids Health Dis. 2013 Oct 29;12:159.

Measurement of biological age with Levine’s Phenotypic Age calculator is strongly correlated with chronological age (r=0.94; see https://michaellustgarten.wordpress.com/2019/09/09/quantifying-biological-age/). In 2019, I measured all 9 of its analytes 3 times, with biological age readings of 35.39y, 35.58y, and 31.3y, for an average 2019 biological age of 34.09y (see https://michaellustgarten.wordpress.com/2019/11/01/biological-age-31-3y-chronological-age-46y/). That’s 12 years younger than my chronological age in 2019, 46y!
On Feb 12, I had my first blood test measurement of 2020. I expected to see a worse biological age, as over the past week, I’d been hit with the flu, and since my last measurement in 2019, I made a few changes to my diet that I didn’t expect to favorably affect it. In contrast, I’ve been purposefully in a mild caloric restriction in an attempt to reduce my body fat from a relatively lean 10-12% to lower values. Since my last blood test 3+ months ago, my average calorie intake was 2553, which is 5-10% less than my maintenance intake, 2700-2800 calories/day. So how did these variables affect my biologic age? Let’s have a look at the data!

My biological age was 32.75y, which is less than my 2019 average value, and better than I expected considering the factors mentioned above! Note that there is room for improvement, including my creatinine and WBC levels, which both increased when compared with my average 2015-2019 values (which included 23 blood tests). My average daily fiber intake has been ~100g/day for a few years, and over the past 3 months, I purposefully reduced that to ~70g/day. Conversely, I increased my intake of meat, eggs, and cheese intake during that period, to see if eating less fiber and more animal products would negatively impact my blood test results. For me, eating more animal protein and less total fiber may not be optimal, as my creatinine levels also rose in 2019 when I performed a similar dietary experiment. Note that creatinine levels increase with age (see https://michaellustgarten.wordpress.com/2019/11/18/optimizing-biologic-age-creatinine/), so if I can avoid that by altering my diet, I will. For the next blood test, I’ll reduce, but not eliminate my intake of meat, eggs, and cheese, and I expect that my creatinine levels will decrease back towards my average 2015-2019 value of 0.94 mg/dL.
Also note my WBCs-although they’re not higher than the 3.5-6 optimal range (see https://michaellustgarten.wordpress.com/2019/10/11/blood-testing-whats-optimal-for-wbc-levels/), they’re increased when compared with my average 2015-2019 value of 4.5. This increase is more than likely a result of the flu/infection that I’m battling. Once it passes, I expect it to return to close to my average WBC value, ~4.5.
Going forward, I expect my creatinine and WBCs to come down to their average values, which would result in a biological age that is closer to 30y on my next blood test. Stay tuned for that data!
To quantify your biological age using Levine’s Phenotypic Age calculator, here’s the Excel link! DNAmPhenoAge_gen (1)
If you’re interested, please have a look at my book!

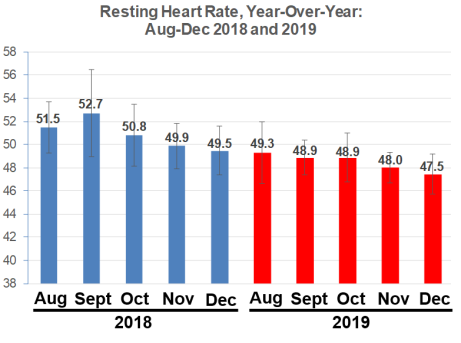
In earlier posts, I reported year-over-year improvements for my resting heart rate (RHR), from 51.5 (bpm) when I first started tracking in August 2018 to 48 bpm in November 2019 (https://michaellustgarten.wordpress.com/2019/12/05/resting-heart-rate-heart-rate-variability-still-making-progress/). Did my year-over-year RHR improvement continue in December 2019?
As shown below, in December 2018, my average RHR was 49.5 bpm. In December 2019, it was 47.5! These data are significantly different (p=6.5E-05):
While RHR is one metric of cardiovascular health, heart rate variability (HRV) is another. With a stronger heart, the expectation would be a lower RHR, but a higher HRV. December 2019 was my best month ever for HRV, with an average HRV value of 86.3!
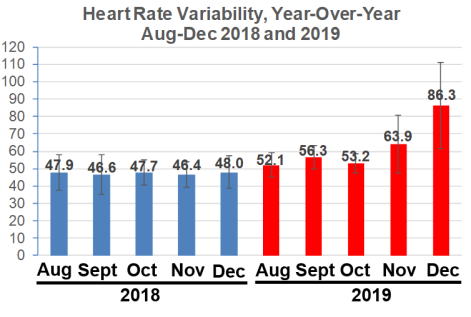
Also note that December 2019’s HRV value is significantly different when compared with December 2018 (p=1.6E-11).
How am I able to continuously improve my RHR, and recently, my HRV? I average 15-20 miles of walking per week, and 3-4 days/week of structured exercise (1 hr/session), including a combination of weights, core, and stretching. My average HR during my structured workouts had been ~105 bpm prior to the past few months, but in November and December 2019 I made more of an effort to minimize rest periods, and included higher reps to keep my exercise HR as high as possible. My goal is to get my RHR to 40 bpm, which is associated with maximally reduced risk of death for all causes (https://michaellustgarten.wordpress.com/2019/02/02/resting-heart-rate-whats-optimal/). Stay tuned for more RHR and HRV data next month!
If you’re interested, please have a look at my book!
The percentage of lymphocytes is one of the 9 blood test variables included in the biological age calculator, Phenotypic Age (https://michaellustgarten.wordpress.com/2019/09/09/quantifying-biological-age/). The reference range for lymphocyte % is 20 – 40% of the total amount of white blood cells (WBCs), but are higher or lower values optimal for health and longevity?
To answer that question, it’s important to know how levels of lymphocytes change during aging, and its association with risk of death for all causes. In one of the earliest studies to examine how the percentage of lymphocytes changes with age, Levine (2013) reported that lymphocyte % significantly decreased during aging in 9,389 adults (age range, 30 – 75y). However, the absolute values for these changes, i.e. from 40% to 30%, for ex., was not reported.
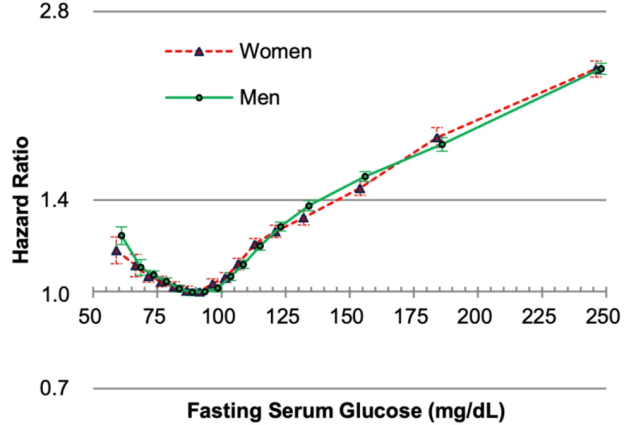
Similarly, lymphocyte % decreased during aging in a much larger study (377,686 subjects; age range, 18 – 85y; Wang et al. 2017):

Interestingly, for women, lymphocyte % decreased from 27% to 21% from 20 – 35y, increased from 21% to 26% from 35 – 55y, then again decreased from 26% to 20% from 55y to 85y. In contrast, lymphocyte % more steadily decreased for men, from 28% to 17% from 20 – 85y.
Based on the aging data, higher values for lymphocyte % are are associated with biologic youth, whereas lower values are found in older adults. Although there are few studies that have investigated associations between lymphocyte % with aging or disease risk, in contrast, more studies have been published for absolute levels of lymphocytes.
In a small study of 106 older adults (> 85y) that were healthy (i.e. free of disease) at baseline, lymphocytes less than 1.14*10^9 cells/L (equivalent to 1140*10^6 cells/L) was associated with an increased risk of death for all causes, when compared with 1850*10^6 cells/L (Izaks et al. 2003):

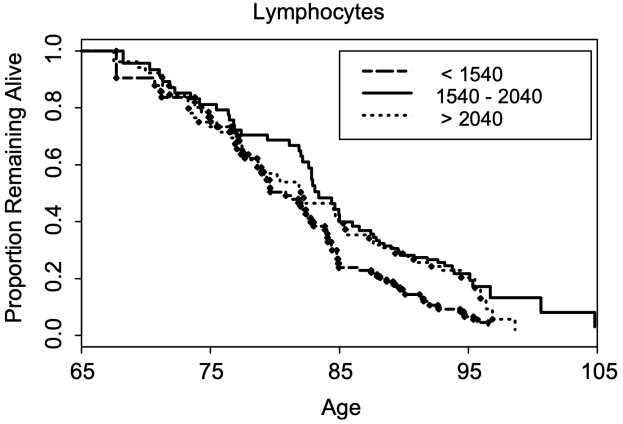
In a larger study (624 subjects), lymphocytes less than 1540*10^6 cells/L was associated with a significantly shorter average lifespan (~5y; 0.5 proportion remaining below), when compared with 1540 – 2040*10^6 cells/L . Also note that survival for the group that had 1540 – 2040*10^9 lymphocytes/L was not significantly different from the group that had more than 2040*10^9 lymphocytes/L (Leng et al. 2005):
In agreement with the smaller studies, lymphocytes < 1300 and < 1200*10^6 cells/L in women and men (red and blue, far left), respectively was associated with an increased all-cause mortality risk, when compared with average lymphocyte values ~1900*10^6 cells/L (decile 5) in a larger study that included 262,394 non-smokers (age range, 37 – 73y; Welsh et al. 2018):

Collectively, these data suggest that higher values for lymphocyte % and for the absolute amount of lymphocytes may be optimal for minimizing disease risk and for maximizing longevity. If both are low, can they be raised? Circulating levels of lymphocytes are reduced during zinc deficiency (Fraker and King, 2001), so monitoring zinc intake, then increasing it to at least the RDA may be a first step towards increasing lymphocyte levels and %.
If you’re interested, please have a look at my book!
References
Fraker PJ, King LE. A distinct role for apoptosis in the changes in lymphopoiesis and myelopoiesis created by deficiencies in zinc. FASEB J. 2001 Dec;15(14):2572-8.
Izaks GJ, Remarque EJ, Becker SV, Westendorp RG. Lymphocyte count and mortality risk in older persons. The Leiden 85-Plus Study. J Am Geriatr Soc. 2003 Oct;51(10):1461-5.
Leng SX, Xue QL, Huang Y, Ferrucci L, Fried LP, Walston JD. Baseline total and specific differential white blood cell counts and 5-year all-cause mortality in community-dwelling older women. Exp Gerontol. 2005 Dec;40(12):982-7.
Levine ME. Modeling the rate of senescence: can estimated biological age predict mortality more accurately than chronological age? J Gerontol A Biol Sci Med Sci. 2013 Jun;68(6):667-74. doi: 10.1093/gerona/gls233.
Wang Z, Li L, Glicksberg BS, Israel A, Dudley JT, Ma’ayan A. Predicting age by mining electronic medical records with deep learning characterizes differences between chronological and physiological age. J Biomed Inform. 2017 Dec;76:59-68. doi: 10.1016/j.jbi.2017.11.003.
Welsh C, Welsh P, Mark PB, Celis-Morales CA, Lewsey J, Gray SR, Lyall DM, Iliodromiti S, Gill JMR, Pell J, Jhund PS, Sattar N. Association of Total and Differential Leukocyte Counts With Cardiovascular Disease and Mortality in the UK Biobank. Arterioscler Thromb Vasc Biol. 2018 Jun;38(6):1415-1423. doi: 10.1161/ATVBAHA.118.310945.

My average biological age in 2019 is 12 years younger than my chronological age (46y) based on the Phenotypic Age calculator (https://michaellustgarten.wordpress.com/2019/11/01/biological-age-31-3y-chronological-age-46y/), and 16y younger based on aging.ai (https://michaellustgarten.wordpress.com/2019/11/04/years-of-biological-aging-in-the-past-4-years/). One factor that likely contributes to my relatively youthful biological age is my diet.
Shown below is my average daily dietary intake from January 1 through November 7th, 2019 (n=306 days). I weigh all of my food with a food scale, so these aren’t estimated amounts:
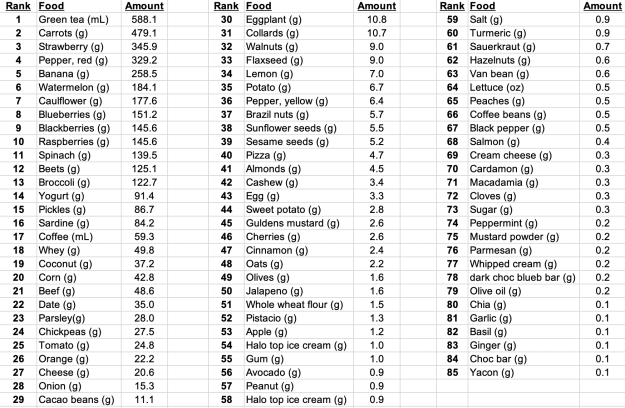
In terms of weight (or volume), green tea is atop the list, as I drink 20 oz/day. Carrots come in second place (for why, see https://michaellustgarten.wordpress.com/2018/07/06/serum-albumin-and-acm/), followed by strawberries, red bell peppers, bananas, watermelon (for the lycopene), cauliflower, blueberries, blackberries, and raspberries. Note that I mix the bananas and berries in my green smoothies, which I drink 3-4x/week, which includes spinach (#11) and parsley (#23).
What does my average daily macro- and micro-nutrient data look like for 2019?

Note that I purposefully have higher than the RDA values for several nutrients, including Vitamin C (see https://michaellustgarten.wordpress.com/2019/09/19/vitamin-c-dietary-intake-and-plasma-values-whats-optimal-for-health/), Vitamin K (see https://michaellustgarten.wordpress.com/2015/05/08/eat-more-green-leafy-vegetables-reduce-mortality-risk/), selenium (see https://michaellustgarten.wordpress.com/2015/05/28/selenium-dietary-intake-and-plasma-values-whats-optimal-for-health/), and others (see michaellustgarten.com).
In terms of supplements, I use 1000 IU of vitamin D from November – May, and I take a methylfolate-methylB12-B6 supplement, to help keep my homocysteine levels low.
If you’re interested, please have a look at my book!

On June 10, 2019 (for the first time) I measured all of the blood test variables that are included in the biologic age calculator, Phenotypic Age, and ended up with a biological age = 35.39y (https://michaellustgarten.wordpress.com/2019/09/09/quantifying-biological-age/).
While that value is 23% younger than my chronological age (46y), I knew that I could do better! So I tried again on September 17, 2019. Basically, the same biological age, 35.58y:

An 23% younger biological age on 2 separate dates, months apart might be good for most, but not for me. So, I tried again on October 29th, 2019, and voila, a biological age of 31.3y, which is 32% younger than my chronological age! How did I do it?

From my last blood test until my most recent blood test, I attempted a mild caloric restriction. To maintain my body weight, I require about 2800 calories per day, an amount which is based on daily body weight weighing in conjunction with daily dietary tracking. For the period of time that elapsed between my last 2 blood tests, I averaged 2657 calories/day, which is 3.2% less than the 2745 calories/day that I averaged for the dietary period that corresponded to my September blood test. That I was also in a very mild caloric restriction is confirmed by a reduction in my average body weight, which was (purposefully) down 0.7 lbs from September 17 to October 29th, when compared with the dietary period that corresponded to my September blood test (August 20 – September 17).
This is a superficial analysis of how I further reduced my biological age, but in future posts I’ll report the average dietary intake that corresponded to my relatively youthful biologic age!
If you’re interested, please have a look at my book!

Platelets are one of the 19 variables that are included in the biological age calculator, aging.ai. The reference range is 150-400 platelets per nanoliter (*10^9/L), but within that range, what’s optimal?
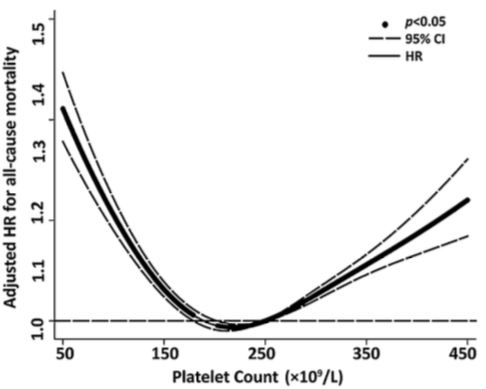
In a study of 21,635 adults older than 35y (average age wasn’t reported), platelets between 230-270 were associated with a maximally reduced risk of death from all causes (Bonaccio et al. 2016):
Similarly, in a study of 21,252 adults (average age 53y), values ~250 were associated with maximally reduced risk of death from all causes Vinholt et al. (2017) :
What about in older adults? In a study of 159,746 postmenopausal women (average age, 63y), maximally reduced risk of death from all causes was associated with platelet values between 200-256 (Kabat et al. 2017).
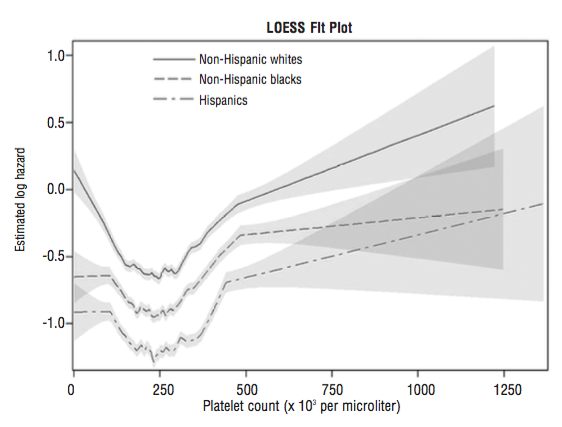
In a smaller study (36,262 older adults, average age, 71y), platelet values ~250 were associated with maximally reduced risk for all-cause mortality. Interestingly, even at platelet values ~250, mortality risk was highest for non-Hispanic whites, when compared with lower mortality risk for non-Hispanic blacks and Hispanics (Msaouel et al. 2014):
In 5,766 older adults (average age, 73y), platelets higher than 200-300 was associated with an increased risk of death from all causes (van der Bom et al 2009). Risk for values between 100-199 was not different when compared against 200-299, but there was a non-significant trend towards increased risk (1.05, 95% CI: 0.97, 1.14).
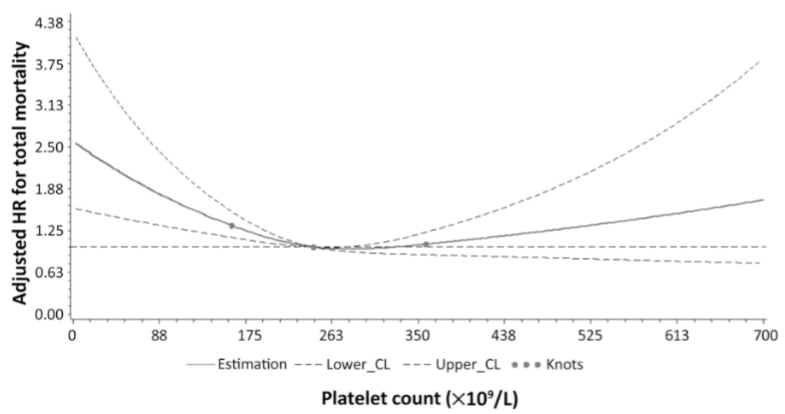
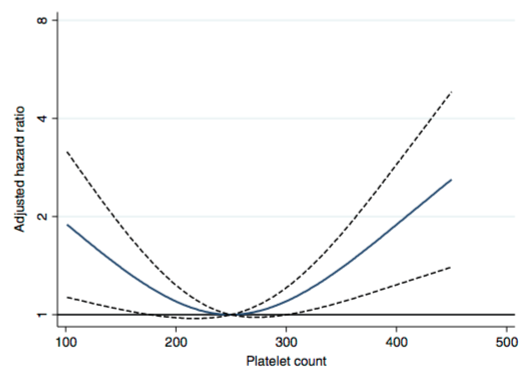
In 131,308 older adults (~73y), maximally reduced risk of death from all causes was associated with platelet values between 200-300, whereas risk significantly increased below and above that range, respectively Tsai et al. (2015):
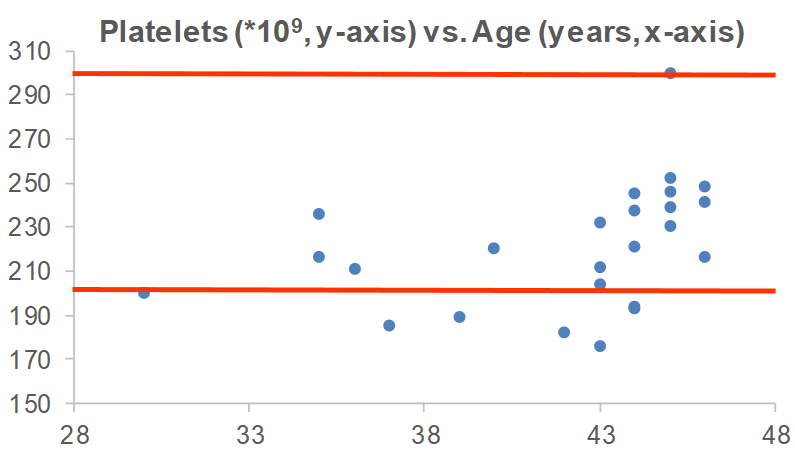
In sum, the data suggests that platelet values ~250 may be optimal for heath, with 200-300 as the “optimal range” within the 150-400 reference range. What are my values? Over the past 16 years, I’ve measured my platelets 25 times, and 6x, my platelets were below this 200-300 range. I’m not too worried about it, though, as most of my measurements are within that range!
Are there any variables that are correlated with platelets? For me, the strongest correlation over 18 tracked blood tests from 2015 – 2019 is my body weight. As my weight increases, my platelets are higher (r = 0.64, p-value = 0.006). Platelets have been reported to increase in association with elevated inflammation (CRP; Izzi et al. 2018), but I only have 3 co-measurements for CRP with platelets. I have a blood test scheduled for next week, more data coming soon!
If you’re interested, please have a look at my book!
References
Bonaccio M, Di Castelnuovo A, Costanzo S, De Curtis A, Donati MB, Cerletti C, de Gaetano G, Iacoviello L; MOLI-SANI Investigators. Age-sex-specific ranges of platelet count and all-cause mortality: prospective findings from the MOLI-SANI study. Blood. 2016 Mar 24;127(12):1614-6.
Izzi B, Bonaccio M, de Gaetano G, Cerletti C. Learning by counting blood platelets in population studies: survey and perspective a long way after Bizzozero. J Thromb Haemost. 2018 Sep;16(9):1711-1721. doi: 10.1111/jth.14202.
Kabat GC, Kim MY, Verma AK, Manson JE, Lin J, Lessin L, Wassertheil-Smoller S, Rohan TE. Platelet count and total and cause-specific mortality in the Women’s Health Initiative. Ann Epidemiol. 2017 Apr;27(4):274-280.
Msaouel P, Lam AP, Gundabolu K, Chrysofakis G, Yu Y, Mantzaris I, Friedman E, Verma A. Abnormal platelet count is an independent predictor of mortality in the elderly and is influenced by ethnicity. Haematologica. 2014 May;99(5):930-6.
Tsai MT, Chen YT, Lin CH, Huang TP, Tarng DC; Taiwan Geriatric Kidney Disease Research Group. U-shaped mortality curve associated with platelet count among older people: a community-based cohort study. Blood. 2015 Sep 24;126(13):1633-5.
Vinholt PJ, Hvas AM, Frederiksen H, Bathum L, Jørgensen MK, Nybo M. Thromb Res.Platelet count is associated with cardiovascular disease, cancer and mortality: A population-based cohort study. 2016 Dec;148:136-142.
