Here’s my latest academic publication!
https://link.springer.com/article/10.1007/s12603-020-1344-1
Exactly 1 month ago, my first biological age measurement of 2020 was 32.75y (https://michaellustgarten.wordpress.com/2020/02/14/biological-age-32-75y-chronological-age-47y-first-2020-measurement/). When considering that my chronological age is 47y, that’s a 14 year improvement, but I wasn’t (and still aren’t) satisfied. When I sent my blood for analysis, I was battling a mild upper respiratory infection (cough, no fever), which likely raised my WBCs, thereby resulting in a higher biologic age. Also, I was experimenting with a higher intake of meat, eggs, and cheese, to see what affect that it would have on my circulating biomarkers. On that blood test in February, my creatinine levels were higher than my 2015-2020 average value, and if those foods were associated with circulating levels of creatinine, reducing them should also reduce creatinine, and accordingly, further improve my biological age. I also assumed that all other variables on Levine’s Phenotypic Age calculator would be unchanged.
On March 9 2020, I sent my blood for analysis so that I could calculate biological age with Levine’s PhenotypicAge. Almost exactly as expected, my WBCs (4.7 * 10^3 cells/microliter) were closer to my 2015-2020 average value (4.6), rather than the higher value (5.8) in my blood test last month. Similarly, reducing my intake of beef, eggs, and cheese brought creatinine from 1.08 to 0.97 mg/dL, which is closer to its 5-year average (0.94 mg/dL). As a result, I further reduced my biological age by 1.14 years to 31.61y, which is 15+ years younger than my chronological!

Because I track my diet every day, I can investigate the correlation between my meat, eggs, and cheese intake with creatinine. I now have 8 blood tests that correspond to dietary data, and interestingly, there is a moderately strong correlation between my average daily beef+egg+cheese intake with creatinine (r = 0.55). Based on these data, I’m going to continue to minimize consumption of these foods, with the goal of optimizing creatinine.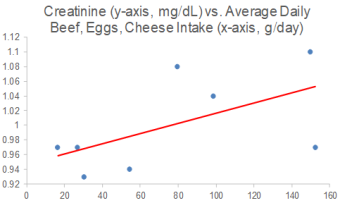
On a final note, I also expected to further reduce my CRP from 0.3 to something lower, but it slightly increased to 0.37 mg/L. While that is far from a high value, lower is better, and in future blood tests I’ll try to figure out how to further reduce it.
If you’re interested in calculating your biological age, here’s the Excel link:
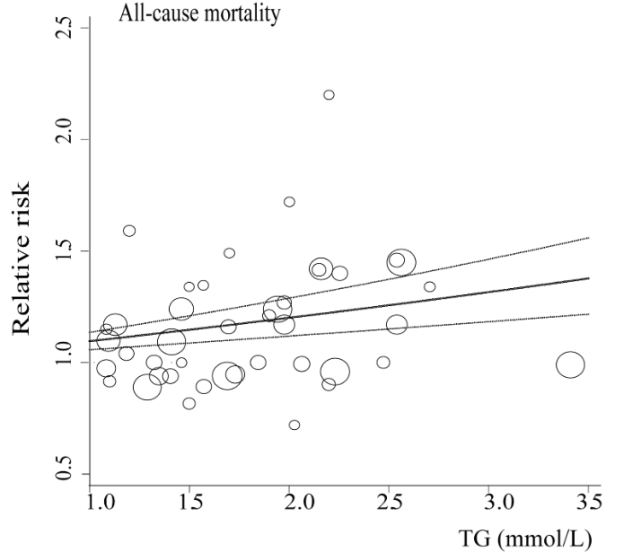
In terms of all-cause mortality risk, is the reference range for circulating triglycerides (TG, <150 mg/dL) optimal?
A meta-analysis of 38 studies in 360,556 subjects with a median age of 48y and a 12-year follow-up reported lowest all-cause mortality risk for subjects with TG values less than 90 mg/dL (equivalent to ~1 mmol; Liu et al. 2013). As shown below, each successive 90 mg/dL increase was associated with a 12% higher all-cause mortality risk. A person with a value closer to the high end of the reference range, ~150 would have a ~7% increased mortality risk compared someone with a value ~90. In other words, there would be 7 more deaths per 100 total people at a TG value of 150, compared with the death rate for people with values less than 90.

Added importance for the association between TG values less than 90 with all-cause mortality risk come from studies of people who have lived longer than 100 years, centenarians. As shown below, triglyceride values less than 101 mg/dL have been reported in 9 of 11 centenarian studies:

What’s my TG value? As shown below, I’ve measured triglycerides 23 times since 2015, with an average value of 52 mg/dL:
With the goal of keeping triglyceride levels low, are there dietary factors that influence it? When compared with my dietary data, the strongest correlation (r = 0.73, R2=0.5339) is present for triglycerides with my calorie intake. In other words, a higher daily calorie intake is associated with higher levels of triglycerides:

Based on this correlation, should my triglycerides start to rise in the future, a first step would be reducing my average daily calorie intake, which since October 2019 has been ~2550 calories/day.
If you’re interested, please have a look at my book!
References
Liu J, Zeng FF, Liu ZM, Zhang CX, Ling WH, Chen YM. Effects of blood triglycerides on cardiovascular and all-cause mortality: a systematic review and meta-analysis of 61 prospective studies. Lipids Health Dis. 2013 Oct 29;12:159.

Measurement of biological age with Levine’s Phenotypic Age calculator is strongly correlated with chronological age (r=0.94; see https://michaellustgarten.wordpress.com/2019/09/09/quantifying-biological-age/). In 2019, I measured all 9 of its analytes 3 times, with biological age readings of 35.39y, 35.58y, and 31.3y, for an average 2019 biological age of 34.09y (see https://michaellustgarten.wordpress.com/2019/11/01/biological-age-31-3y-chronological-age-46y/). That’s 12 years younger than my chronological age in 2019, 46y!
On Feb 12, I had my first blood test measurement of 2020. I expected to see a worse biological age, as over the past week, I’d been hit with the flu, and since my last measurement in 2019, I made a few changes to my diet that I didn’t expect to favorably affect it. In contrast, I’ve been purposefully in a mild caloric restriction in an attempt to reduce my body fat from a relatively lean 10-12% to lower values. Since my last blood test 3+ months ago, my average calorie intake was 2553, which is 5-10% less than my maintenance intake, 2700-2800 calories/day. So how did these variables affect my biologic age? Let’s have a look at the data!

My biological age was 32.75y, which is less than my 2019 average value, and better than I expected considering the factors mentioned above! Note that there is room for improvement, including my creatinine and WBC levels, which both increased when compared with my average 2015-2019 values (which included 23 blood tests). My average daily fiber intake has been ~100g/day for a few years, and over the past 3 months, I purposefully reduced that to ~70g/day. Conversely, I increased my intake of meat, eggs, and cheese intake during that period, to see if eating less fiber and more animal products would negatively impact my blood test results. For me, eating more animal protein and less total fiber may not be optimal, as my creatinine levels also rose in 2019 when I performed a similar dietary experiment. Note that creatinine levels increase with age (see https://michaellustgarten.wordpress.com/2019/11/18/optimizing-biologic-age-creatinine/), so if I can avoid that by altering my diet, I will. For the next blood test, I’ll reduce, but not eliminate my intake of meat, eggs, and cheese, and I expect that my creatinine levels will decrease back towards my average 2015-2019 value of 0.94 mg/dL.
Also note my WBCs-although they’re not higher than the 3.5-6 optimal range (see https://michaellustgarten.wordpress.com/2019/10/11/blood-testing-whats-optimal-for-wbc-levels/), they’re increased when compared with my average 2015-2019 value of 4.5. This increase is more than likely a result of the flu/infection that I’m battling. Once it passes, I expect it to return to close to my average WBC value, ~4.5.
Going forward, I expect my creatinine and WBCs to come down to their average values, which would result in a biological age that is closer to 30y on my next blood test. Stay tuned for that data!
To quantify your biological age using Levine’s Phenotypic Age calculator, here’s the Excel link! DNAmPhenoAge_gen (1)
If you’re interested, please have a look at my book!

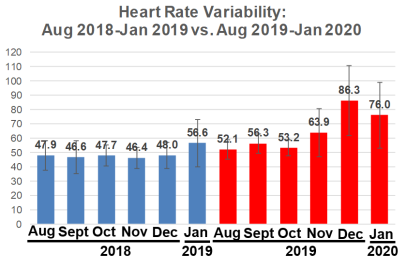
How’s my progress on the road to achieving a resting heart rate (RHR) as close to 40 beats per minute (bpm) as possible? Shown below is my RHR data for August 2018-Jan 2019, which corresponds to the 6-month period after I started tracking RHR. When compared with that period, am I still making year-over-year progress?
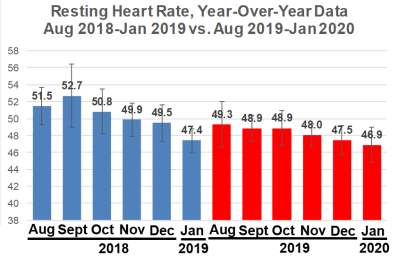
First, note that my Jan 2019 RHR value of 47.4 bpm seems dramatically reduced when compared with Aug-Dec 2018. My computer crashed in Jan 2019, and I lost 4 days of January 2019 RHR data, with remaining data for 27 days. Accordingly, I didn’t expect to be better than that, year-over-year. Nonetheless, my average RHR for Jan 2020 is 46.9 bpm, which is superficially better, but it isn’t statistically different from Jan 2019 (p = 0.13). However, my RHR is still going in the right direction!
What about my heart rate variability (HRV)? Relative to Jan 2019 (56.6), my HRV in Jan 2020 was significantly higher (76; p=0.003), but note that I didn’t additionally improve my HRV relative to December 2019 (86.3).
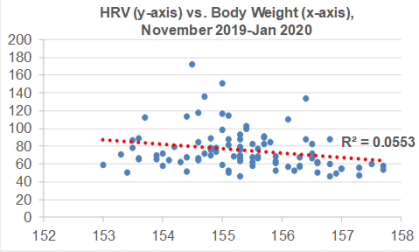
I’ve been consistent with my exercise program, including weekly workouts (3-4x, ~1 hr each session) and walking (15-20 miles), so are there other variables that may explain the sudden increase in HRV from Nov 2019-Jan 2020? During that time, I’ve been cutting my calorie intake by a small amount (~100-200 cals/day) below my body weight maintenance intake, with the goal of getting leaner. As a result, I’ve slowly decreased my body weight from 157 to 154 during that time. Although there is a weak negative correlation between my body weight with HRV (R2=0.0553), this association is statistically significant (p=0.024). So reducing body weight may have played a role in the sudden HRV increase:
For those who may have missed my other post updates for RHR and/or HRV:
Dec 2019 update: https://michaellustgarten.wordpress.com/2020/01/01/resting-heart-rate-heart-rate-variability-december-2019-update/
Oct, Nov 2019 update: https://michaellustgarten.wordpress.com/2019/12/05/resting-heart-rate-heart-rate-variability-still-making-progress/
Sept 2019 update: https://michaellustgarten.wordpress.com/2019/10/08/resting-heart-rate-year-over-year-update/
Also, why a RHR as close to 40 bpm may be optimal: https://michaellustgarten.wordpress.com/2019/02/02/resting-heart-rate-whats-optimal/
If you’re interested, please have a look at my book!

Here’s a link to a recent interview,
Including:
And much more!

In an earlier post (https://michaellustgarten.wordpress.com/2019/09/15/drink-green-tea-reduce-and-all-cause-mortality-risk/), I reported that green tea consumption is associated with reduced risk of death for all causes. Now, there’s more recent data! Drinking more than 1 cup of green tea per day is associated with reduced all-cause mortality risk in a pooled analysis of 8 studies that included 313,381 subjects (age range, 40-103y; Abe et al. 2019).
In women (168,631 subjects), risk of death for all causes was reduced by 10%, 6%, and 18% for 1-2, 3-4, and greater than 5 cups/day, when compared with drinking less than 1 cup per day:

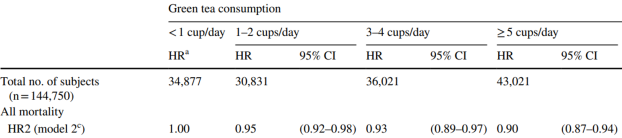
In men (144,750 subjects), risk of death for all causes was reduced by 5%, 7%, and 10% for 1-2, 3-4, and greater than 5 cups/day, when compared with drinking less than 1 cup per day:
Cheers to green tea, for health!
Reference
Abe SK, Saito E, Sawada N, Tsugane S, Ito H, Lin Y, Tamakoshi A, Sado J, Kitamura Y, Sugawara Y, Tsuji I, Nagata C, Sadakane A, Shimazu T, Mizoue T, Matsuo K, Naito M, Tanaka K, Inoue M; Research Group for the Development and Evaluation of Cancer Prevention Strategies in Japan. Green tea consumption and mortality in Japanese men and women: a pooled analysis of eight population-based cohort studies in Japan. Eur J Epidemiol. 2019 Oct;34(10):917-926. doi: 10.1007/s10654-019-00545-y.
If you’re interested, please have a look at my book!
The reference range for uric acid is 4.0 – 8 mg/dL for men, and 2.5 – 7 mg/dL for women. Are these values optimal for health? To answer that question, let’s have a look at how circulating levels of uric acid change during aging, and their association with risk of death for all causes.
Uric acid increases during aging in both men and women. Kuzuya et al. (2002) studied how uric acid changes during a 10-year intervals for various birth cohorts, including 32yr olds, 39yr olds, 47yr olds, 56yr olds, and 65 yr olds (1960-1969, 1950-1959, 1940-1949, 1930-1939, 1920-1929 birth cohorts, respectively). For each birth cohort, uric acid levels increased during aging for men (left image below), whereas they increased for women starting at 40 years old:

In terms of mortality risk, lowest risk of death for all causes was associated with uric acid levels of 5 – 7 mg/dL for men and 4 – 6 mg/dL for women in the 9,118 adults (average age, 43y) of Hu et al. (2019). Also note the U-shaped curve for both genders, whereas mortality risk increases at both low and high levels of uric acid:

Similarly, the lowest risk of death for all causes was associated with uric acid levels of 7 mg/dL for men, and 4 mg/dL for women in the 375,163 adults (average age, 40y) of Cho et al. (2018), with mortality risk significantly increasing at uric levels < 3.5 and > 9.5 mg/dL for men, < 2.5 and > 7.5 mg/dL for women. Collectively, these 2 studies in middle-aged adults suggest that uric acid levels ~ 4 mg/dL for women and ~7 for men may be optimal for reducing risk of disease for all causes. It’s also important to note that both low and higher values are associated with an increased mortality risk.
The data for the Hu and Chu studies are in younger adults, so how does the data look in older adults? Lowest all-cause mortality risk was associated with uric acid levels between 4 – 5 mg/dL in the 121, 771 older adults (average age, 73y) of Tseng et al. (2018), with mortality risk significantly increasing below 4 and > 8:

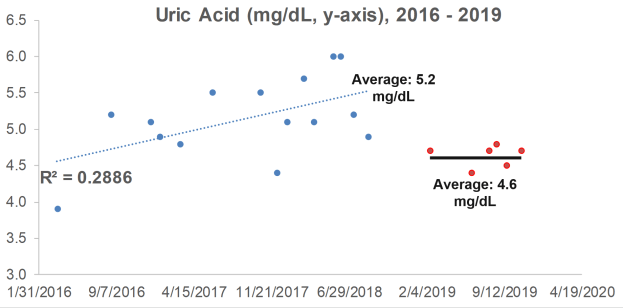
What are my uric acid levels? From 2016 to 2018, I measured it 15x, and although my average value of 5.2 mg/dL is not too low or too high in terms of an increased all-cause mortality risk, it increased during that 3-year period (R2 = 0.2886). When considering that uric acid increases during aging, can I reduce it with diet?

Because I track my daily nutritional intake, I can look for correlations between my dietary intake with circulating biomarkers. Interestingly, a moderately strong correlation between my lycopene intake with uric acid (R2 = 0.3343, p=0.024) was present from 2016 to 2018:

Lycopene is found almost exclusively in tomatoes and watermelon. If these foods are related to my increasing levels of uric acid, if I ate less of them, I’d expect to see a corresponding decrease in uric acid. So, in 2019, I ate less of these foods, thereby reducing my average lycopene intake from 11,585 to 9,132 micrograms per day. How did that affect circulating levels of uric acid?
In 6 measurements for 2019, my average uric acid level was 4.6 mg/dL, a value that was significantly different (p=0.02) from the 2016-2018 average of 5.2 mg/dL. Whether eating less watermelon and tomatoes caused the decrease is unknown, but it’s good to know that uric acid can be potentially modified with dietary change!

If you’re interested, please have a look at my book!
References
Cho SK, Chang Y, Kim I, Ryu S. U-Shaped Association Between Serum Uric Acid Level and Risk of Mortality: A Cohort Study. Arthritis Rheumatol. 2018 Jul;70(7):1122-1132. doi: 10.1002/art.40472.
Hu L, Hu G, Xu BP, Zhu L, Zhou W, Wang T, Bao H, Cheng X. U-Shaped Association of Serum Uric Acid with All-cause and Cause-Specific Mortality in US Adults: A Cohort Study. J Clin Endocrinol Metab. 2019 Oct 25. pii: dgz068. doi: 10.1210/clinem/dgz068.
Kuzuya M, Ando F, Iguchi A, Shimokata H. Effect of aging on serum uric acid levels: longitudinal changes in a large Japanese population group. J Gerontol A Biol Sci Med Sci. 2002 Oct;57(10):M660-4.
Tseng WC, Chen YT, Ou SM, Shih CJ, Tarng DC; Taiwan Geriatric Kidney Disease (TGKD) Research Group. U-Shaped Association Between Serum Uric Acid Levels With Cardiovascular and All-Cause Mortality in the Elderly: The Role of Malnourishment. J Am Heart Assoc. 2018 Feb 10;7(4). pii: e007523. doi: 10.1161/JAHA.117.007523.

Here’s my latest academic paper!

Having a faster rate of epigenetic aging, as measured by the epigenetic age metric, AgeAccelGrim, is associated with a significantly increased risk of death for all causes in a variety of cohorts, including the Framingham Heart Study (FHS), the Women’s Health Initiative (WHI) study, the InChianti study, the Jackson Heart Study (JHS), and collectively, when evaluated as a meta-analysis (Lu et al. 2019):

With the goal of minimizing disease risk and maximizing longevity, can epigenetic aging be slowed? Shown below is the correlation between dietary components with AgeAccelGrim. Dietary factors that were significantly associated (the column labelled, “p”) with a younger epigenetic age were carbohydrate intake, dairy, whole grains, fruit, and vegetables. In contrast, dietary fat intake and red meat were associated with older epigenetic ages (Lu et al. 2019):

Note that dietary recall data as a means for identifying nutrient intake can be unreliable-a better measure of dietary intake is circulating biomarkers. Are there associations between circulating biomarkers of nutrient intake with epigenetic aging?
Higher blood levels of carotenoids, including lycopene, alpha- and beta-carotene, lutein+zeaxanthin, and beta-cryptoxanthin were associated with a younger epigenetic age (Lu et al. 2019):

If your goal is optimal health and longevity, eating foods that are rich in these nutrients may be an important strategy for slowing epigenetic aging. Which foods contain these nutrients? Carotenoids are found almost exclusively in vegetables and fruits. For example, lycopene is enriched in watermelon and tomatoes, alpha- and beta-carotene is high in carrots, orange vegetables (sweet potato, squash, pumpkin) and greens, lutein+zeaxanthin is prevalent in greens, and beta-cryptoxanthin’s highest levels are found in butternut squash and red bell peppers.
If you’re interested, please have a look at my book!
References
Nutrient composition data: https://reedir.arsnet.usda.gov/codesearchwebapp/(S(ujsr52ygvp0tw13m1luk0rny))/CodeSearch.aspx
Lu AT, Quach A, Wilson JG, Reiner AP, Aviv A, Raj K, Hou L, Baccarelli AA, Li Y, Stewart JD, Whitsel EA, Assimes TL, Ferrucci L, Horvath S. DNA methylation GrimAge strongly predicts lifespan and healthspan. Aging (Albany NY). 2019 Jan 21;11(2):303-327. doi: 10.18632/aging.101684.
